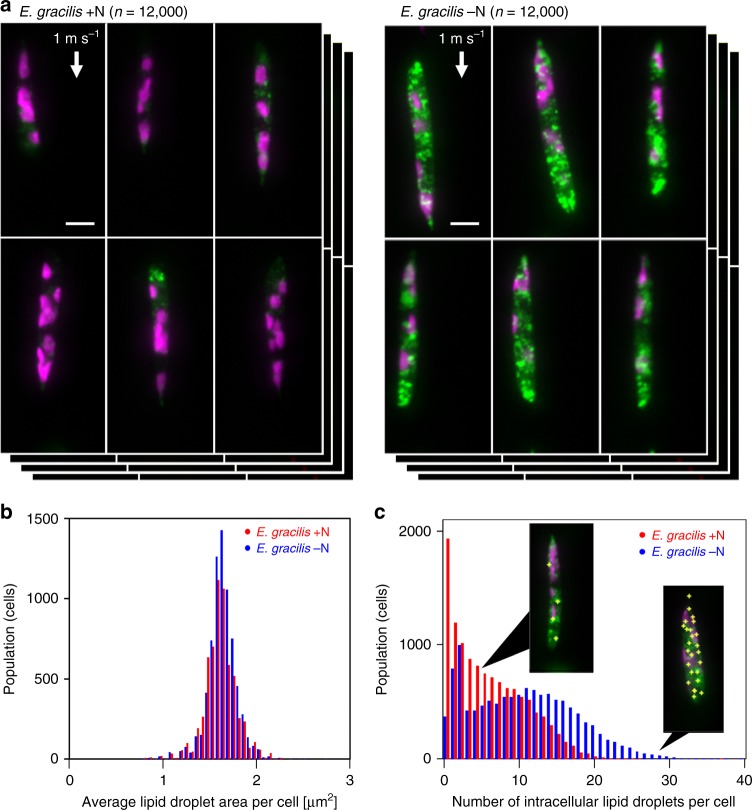
Fig. 5. High-throughput, high-content screening of E. gracilis cells.
a Fluorescence images of nitrogen-sufficient (+N) and nitrogen-deficient (−N) E. gracilis cells (n = 12,000 for each group) obtained by VIFFI flow cytometry. The lipids (shown in green) were stained by BODIPY505/515 while chlorophyll (shown in magenta) was autofluorescent. See Supplementary Figs. 16 and 17 for more images. b Histograms of E. gracilis cells in the average droplet area per cell (n = 7499 for each group). The source data is available in our Source Data file. c Histograms of E. gracilis cells in the number of intracellular lipid droplets per cell (n = 11,999 for each group). Yellow plus signs in the insets indicate the locations of lipid droplets within the cell body. It is important to note that while the average droplet area does not change under two culture conditions, the number of lipid droplets varies significantly. The near-origin peak of the E. gracilis –N histogram is due to isolated lipid droplets, presumably caused by the fracture of cells in the sample preparation process (see Supplementary Fig. 21). The source data is available in our Source Data file. Scale bars: 10 µm.

