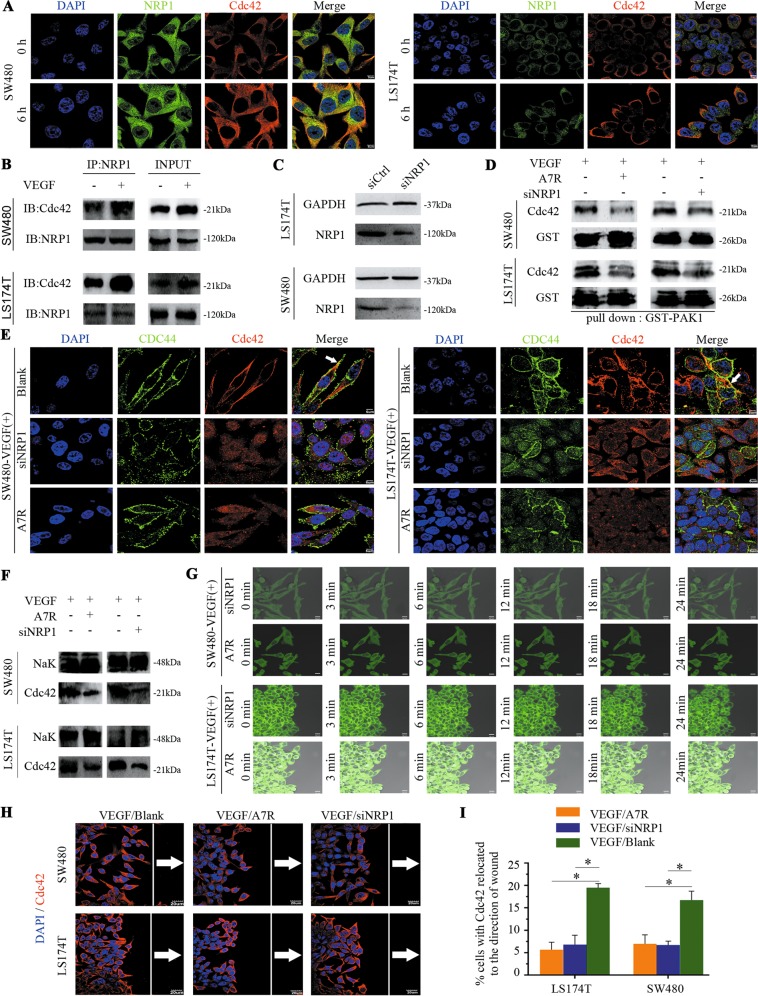
Fig. 3. NRP1 is required for Cdc42 activation, and Cdc42 knockdown or A7R blockade impairs Cdc42 activation and relocation in CRC cells.
a Cdc42 and NRP1 have dual staining in CRC cells. Scale bar: 5 μm. b NRP1 and Cdc42 are expressed in CRC cells with (+) or without (−) VEGF (50 ng/mL) treatment in the coimmunoprecipitation assay. c Western blot analysis of NRP1 in control (si-Ctrl) and NRP1 knockdown (si-NRP1) cells. d SW480/LS174T cells were transfected with control (−) or NRP1 siRNA (+) and then cultured with 50 ng/mL VEGF. SW480/LS174T cells were cultured with 50 ng/mL VEGF and either treated (+) or not (−) with A7R for 24 h. The lysates were obtained, and Cdc42-GTP levels were assessed using the PAK1 pull-down assay. e Cdc42/CD44-stained SW480/LS174T cells. SW480/LS174T cells were cultured with 50 ng/mL VEGF (VEGF/Blank); SW480/LS174T cells were cultured with 50 ng/mL VEGF mixed with A7R (VEGF/A7R or A7R); or SW480/LS174T cells were transfected with NRP1 siRNA and then cultured with 50 ng/mL VEGF (VEGF/siNRP1 or siNRP1). Scale bar: 5 μm. f Cell membrane fractions were isolated and probed for Cdc42. g, h SW480/LS174T cells were treated as follows: SW480/LS174T cells were cultured to confluency on glass coverslips, starved, scratched, and cultured with 50 ng/mL VEGF (VEGF/Blank) or with 50 ng/mL VEGF mixed with A7R (VEGF/A7R or A7R). Alternatively, SW480/LS174T cells were transfected with NRP1 siRNA and were cultured to confluency on glass coverslips, starved, scratched, and then cultured with 50 ng/mL VEGF (VEGF/siNRP1 or siNRP1). g shows Cdc42 localisation of the front in live CRC cells, scale bar, 10 μm. Frames from typical time-lapse sequences show SW480 and LS174T cells with unrecognisable protrusions even at 24 min. h shows fluorescent immunostaining of fixed Cdc42 (in red) and nuclei in blue (DAPI). White arrows point to Cdc42 in cells that are oriented towards the front. The white reference line is parallel to the scratched edge to determine individual cell polarisation vs. cells polarised towards the scratched edge. Scale bar, 20 μm. i Quantitative analysis shows the percentage of cells with Cdc42 oriented towards the front. Error bars represent the mean ± SD of triplicate experiments, *P < 0.001.

