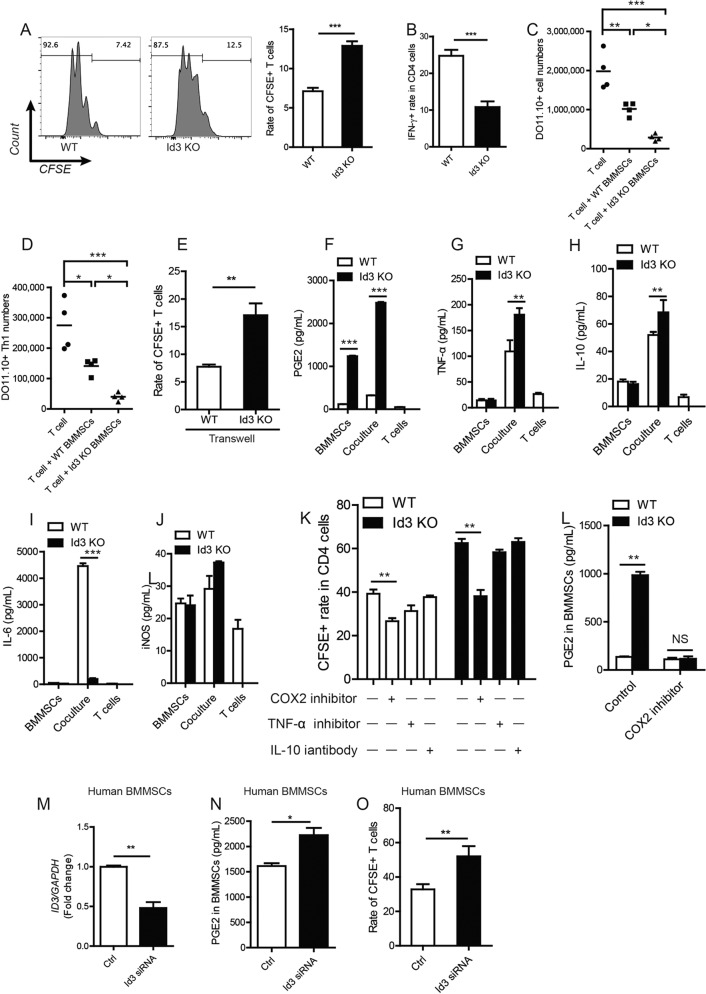
Fig. 1. Id3−/− BMMSCs enhanced immunosuppression of Id3-deficient BMMSCs to T-cell proliferation and IFN-gamma production in vitro and in vivo.
a CFSE analysis of cell proliferation for T cells cultured with bone marrow-derived mesenchymal stem cells (BMMSCs) form WT mice and Id3−/− mice (WT and Id3 KO). b Frequencies of IFN-γ producing Th1 cell subsets in the presence of Id3−/− BMMSCs or WT BMMSCs; WT or Id3−/− BMMSCs and CD4+ T cells derived from DO11.10 TCR-transgenic mice were mixed at a ratio of 1:2 and injected into BALB/cJ mice. c, d Flow cytometric analyses showing changes in CD4+ T and Th1 cell number in BALB/cJ mice injected with CD4+ T cells from DO11.10 TCR-transgenic mice combined with Id3−/− or WT BMMSCs and a subsequent ovalbumin challenge, compared with T cells only. e T-cell proliferation when cocultured with WT or Id3−/− BMMSCs in Transwell plates. f–j Changes in PGE2, TNF-α, IL-10, IL-6 and inducible nitric oxide synthase (iNOS) expression in supernatants of WT or Id3−/− BMMSCs, T cells and cocultures. k Effect of COX2 IL-10, TNF-α or IL-10 inhibition on immunosuppressive effects of WT and Id3−/− BMMSCs. l PGE2 secretion in response to COX2 inhibition. m ID3 expression, as assessed by Western blot, in human BMMSCs transfected with ID3-specific siRNA or siRNA only (Ctrl). n PGE2 secretion, as assessed by ELISA, in control and ID3-knockdown human BMMSCs. o CFSE analyses of cell proliferation in T cells cultured with ID3-knockdown human BMMSCs versus control BMMSCs. Values are means ± SD (n = 5, three independent experiments). Student’s t tests and one-way ANOVA. *P ≤ 0.05; **P ≤ 0.01; ***P ≤ 0.001.

