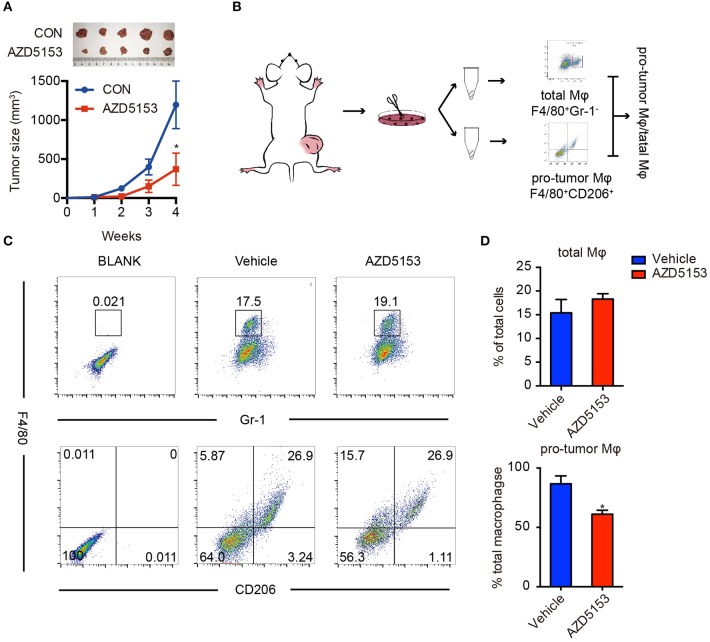
Figure 1.
AZD5153 scaled down M2-like macrophages in solid tumor. (A) Representative images and tumor volume measurements of CT26 tumors in BALB/c mice with continuous treatment (n = 5); volume of tumor was measured every week: V = (L × W2)/2. The mice were treated with AZD5153 (0.5 mg/ml) or vehicle 100 μl/day by gavage for 4 weeks. (B) Diagram for flow cytometry experiments. Tumors from the same group were dissociated and equally divided into two Eppendorf tubes for flow cytometry analysis. (C) Flow cytometry analysis of total macrophages (top) and M2-type macrophages (bottom) in CT26 tumors after treatments. (D) Bar chart for (C). Data represent mean ± SEM. *P < 0.05.

