Figure 4.
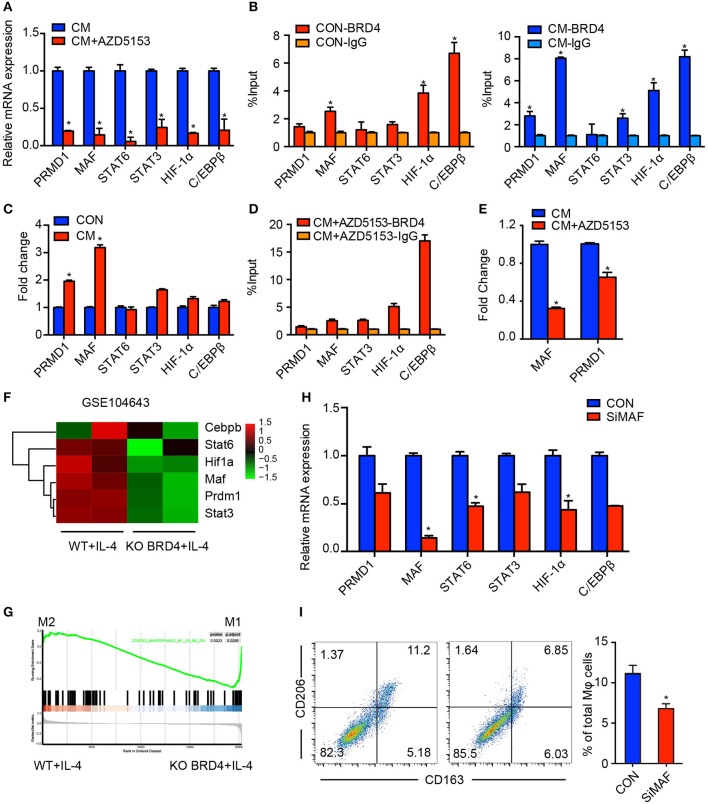
AZD5153 depolarizes M2-like macrophages by inhibiting MAF. (A) qPCR evaluation of transcription factors including PRMD1, MAF, STAT6, STAT3, HIF-1α, and C/EBPβ in CM-induced macrophages treated with and without AZD5153. (B,C) ChIP-PCR evaluation of binding events between each transcription factor and BRD4 in macrophages induced with and without CM. (D) ChIP-PCR evaluation of binding events between each transcription factor and BRD4 in macrophages induced with CM and treated with AZD5153. (E) ChIP-PCR evaluation of binding events between BRD4 and two transcription factors MAF and PRMD1 in CM-induced macrophages treated with and without AZD5153. (D) The mRNA expressions of six transcription factors in (A) were analyzed by qPCR in MAF and control (NC) siRNA in CM-induced macrophages. (F) The differential analysis of six transcription factors between the wild-type mouse model and BRD4-knockout mouse model under the stimulation of IL-4 (GSE104643). (G) The GSEA analysis of the same dataset in (E). (H) The mRNA expression of six transcription factors in (A) were analyzed by qPCR in MAF and control (NC) siRNA in CM-induced macrophages. (I) Flow cytometry analysis for the percentage of CD206+CD163+ macrophages among total macrophages. Left: diagram for flow cytometry analysis. Right: bar chart for flow cytometry analysis (n = 3). Data represent mean ± SEM. *P < 0.05.

