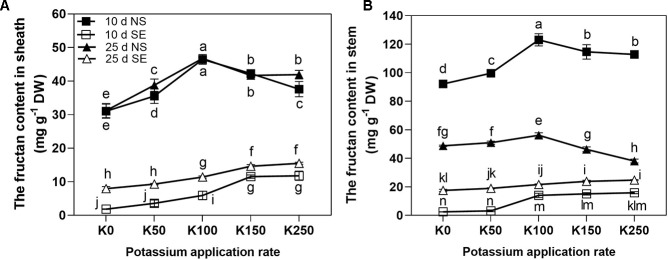
Figure 5.
The fructan contents in sheath (A) and stem (B) under different treatments. The error bars stand for standard deviations of the means of five independent biological replicates. For each trait, different letters represent significant difference from each other according to three-way repeated measures ANOVA followed by least significant difference (LSD) multiple comparison (P < 0.05). NS: no shading treatment; SE: shading from the 1st day to the 10th day after anthesis (shading at early filling stage for 10 days, SE); Five potassium rate: 0 (K0), 50 (K50), 100 (K100), 150 (K150), and 250 (K250) mg K2O kg-1 soil in the form of KCl.

