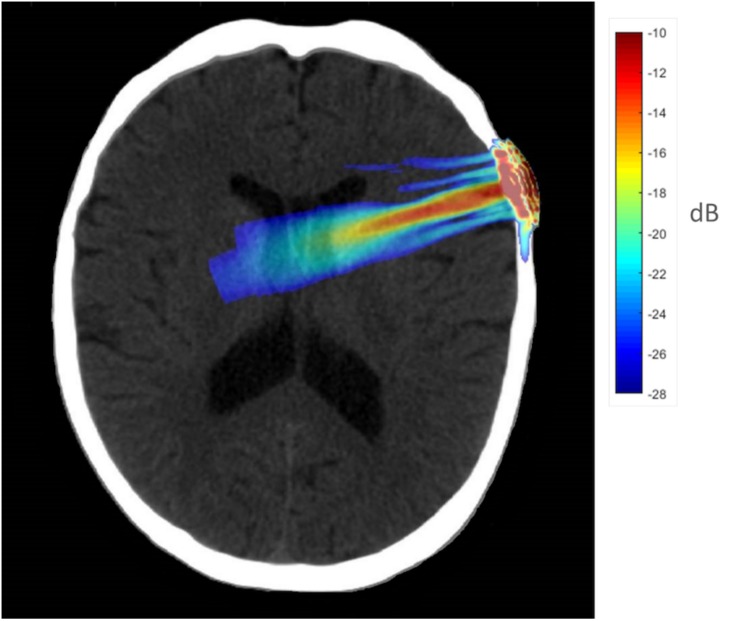
FIGURE 1.
Acoustic simulation model on a representative CT scan of a male patient. The transducer was positioned over the F8 EEG electrode location on the scalp which centers over the rIFG. Hotter colors (red, yellow) indicate more intense sonication, cooler colors (blue, green) indicate less intense sonication.

