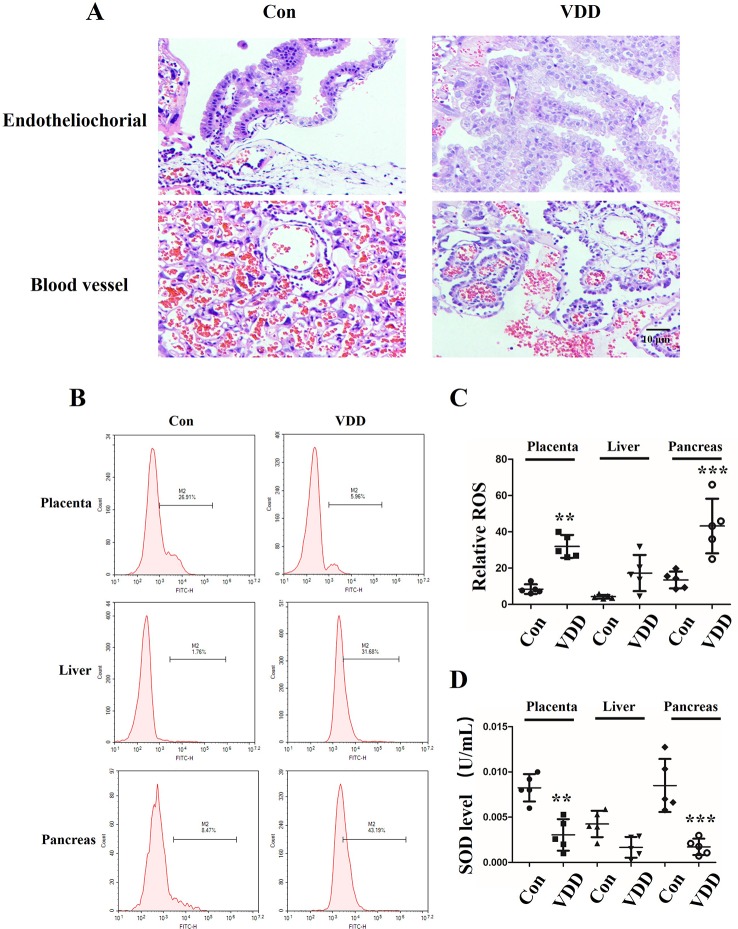
Figure 2.
Structure change of the placenta and ROS accumulation under maternal vitamin D deficiency status. (A) HE staining for blood vessel numbers and amniotic epithelium information in SD rat placenta on gestation day 21. (B) The ROS levels in maternal placenta, liver, and pancreas were assessed by flow cytometry using the CM-H2DCFDA fluorescence probe. (C) The percentage of fluorescence intensity was calculated as relative ROS level in maternal placenta, liver, and pancreas. (D) The SOD levels were detected in the maternal in maternal placenta, liver, and pancreas. The data are expressed as the means ± SD of at least three independent experiments. n = 5 rats per group. **P < 0.01, ***P < 0.001 represents the comparisons between maternal 25-hydroxyvitamin D deficiency group (VDD) and normal control group (Con). Normal group, Con; maternal 25-hydroxyvitamin D deficiency group, VDD; week, w.

