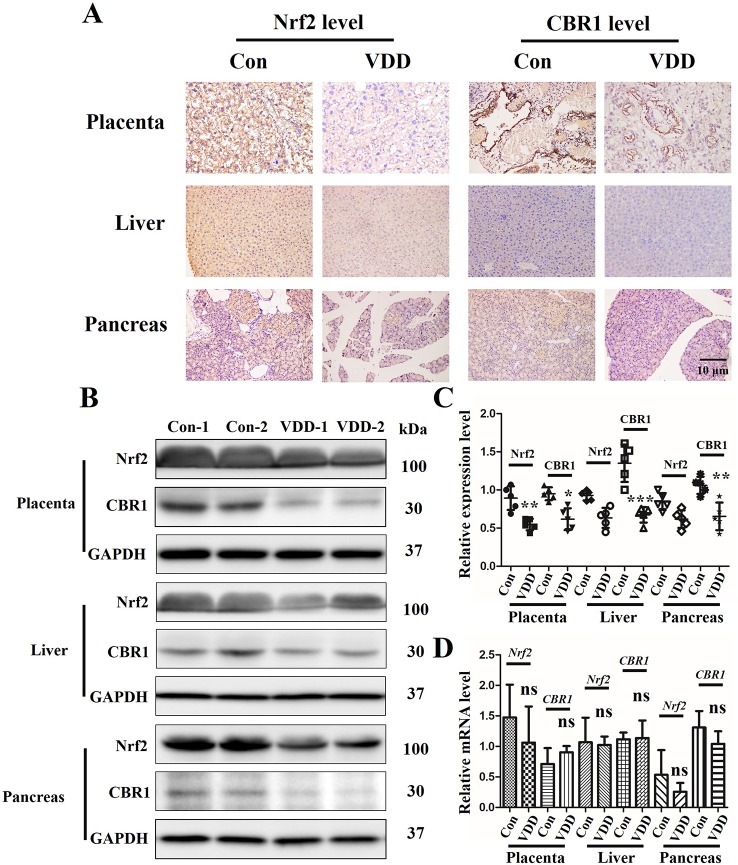
Figure 4.
The effect of Maternal 25-hydroxyvitamin D deficiency on the expression level of Nrf2 and CBR1 in maternal placenta, liver, and pancreas tissues. (A) Nrf2 and CBR1 immunohistochemical staining in maternal placenta, liver, and pancreas tissues obtained in normal group and 25-hydroxyvitamin D deficiency group (magnification, ×200). (B–D) Application of Western blot (B, C) and qT-PCR (D) to ascertain the protein and mRNA expression levels, respectively, in maternal placenta, liver, and pancreas tissues. Mean ± SD, n = 5 rat per group. *P < 0.05, **P < 0.01, **P < 0.001 vs. control group; ns, no significance. Normal group, Con, Con-1, and Con-2 represent different rats; maternal 25-hydroxyvitamin D deficiency group, VDD, VDD-1, and VDD-2 represent different rats.

