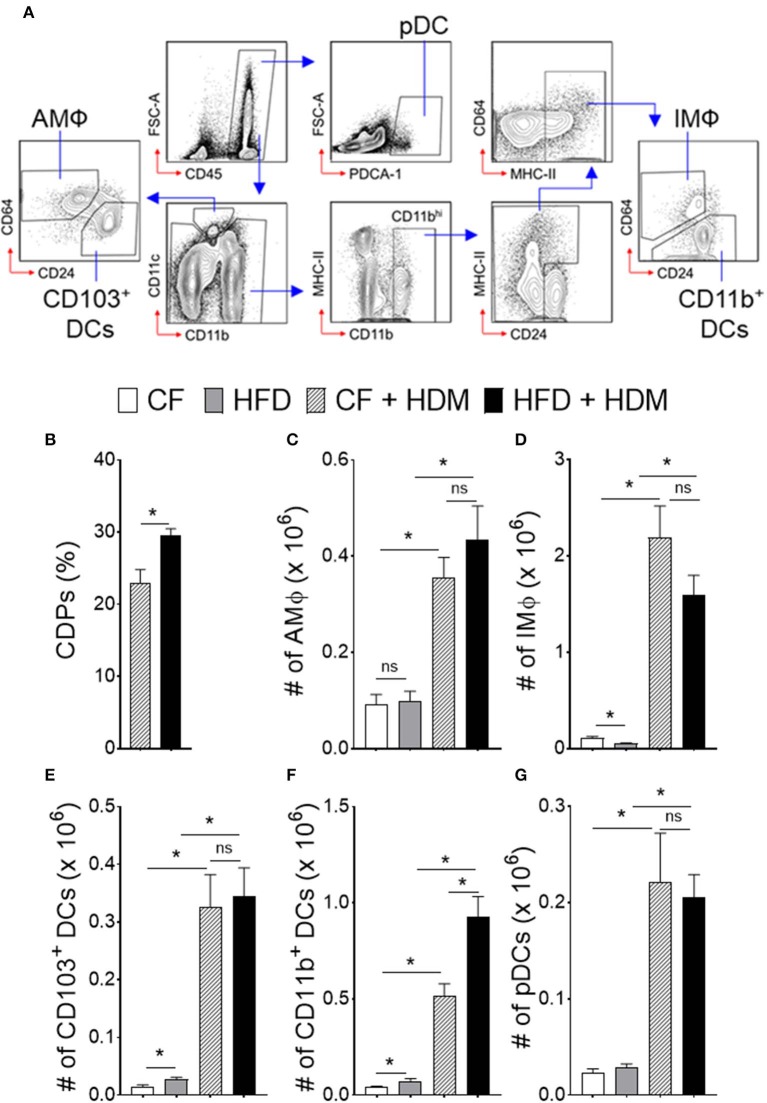
Figure 4.
Obesity alters myeloid cell accumulation in airway inflammation. Naïve HFD and CF mice were sensitized, as mentioned in Figure 3. One day after the last HDM sensitization, lungs were analyzed for different subsets of antigen presenting myeloid cells. (A) FACS plot show the gating strategy. Blue arrows show the gating hierarchy. (B) Bar graph showing mean percentages of CDPs in the BM and (C) number of alveolar macrophages, (D) interstitial macrophages, conventional (E) CD103+ DCs, and (F) CD11b+ DCs and (G) plasmacytoid DCs in the lung. Data are representative of two independent sets of experiment and expressed as mean ± s.e.m. n = 8–10/group. One-way ANOVA with Sidak's multiple comparison test. *P < 0.05. AMΦ, Alveolar Macrophage; IMΦ, Interstitial Macrophage; pDCs, Plasmacytoid DCs.

