Figure 5.
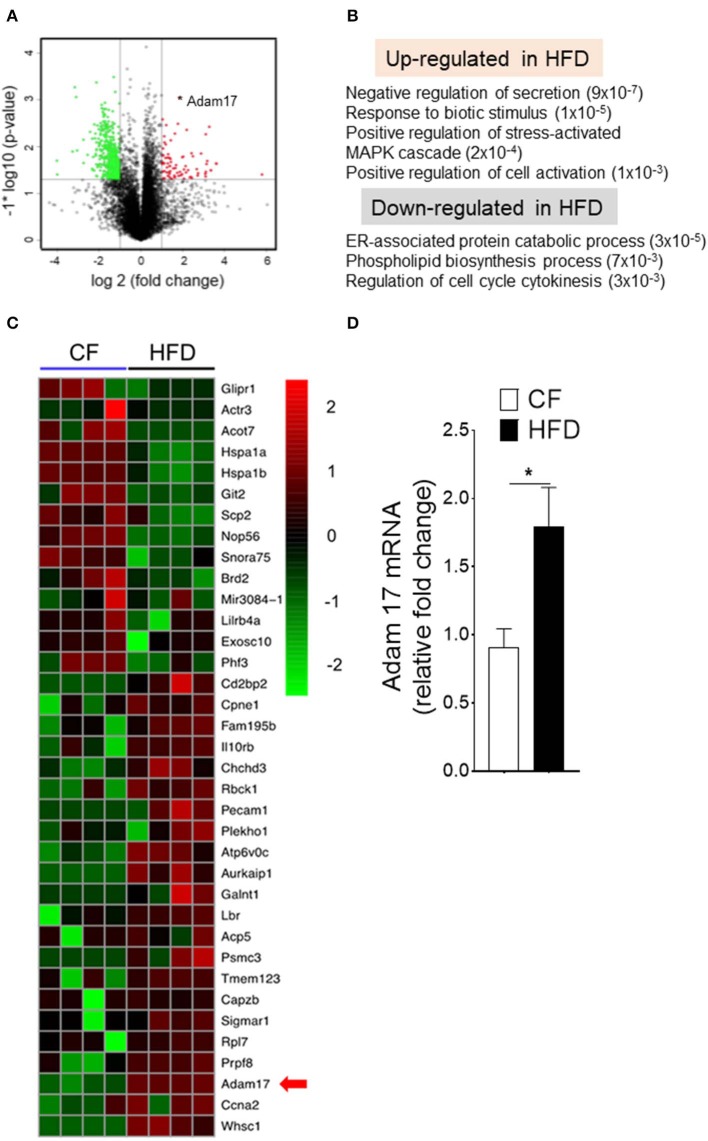
Obesity regulates Adam17 expression in DC-restricted progenitors. (A) Volcano plot of log2 fold changes vs. one-way ANOVA p-value (–log10 scale) between expressions of mRNA isolated from BM CDPs of CF and HFD mice. Each dot represents one transcript. The transcript of Adam17 is indicated with an asterisk. (B) GSEA for dysregulated genes in HFD CDPs. Numbers in parenthesis indicate adjusted p-values. (C) Heat map of differentially expressed genes based on transcript-level RNA-seq results. Top 70% of genes with a p-value < 0.05 and the corresponding log2 fold change >2 or <-2 are shown. (D) qRT-PCR analyses for Adam17 gene expression in CDPs isolated from CF and HFD mice. Results are expressed as fold change ± s.e.m normalized to β-actin expression. n = 4/group. Student's t-test *P < 0.05.

