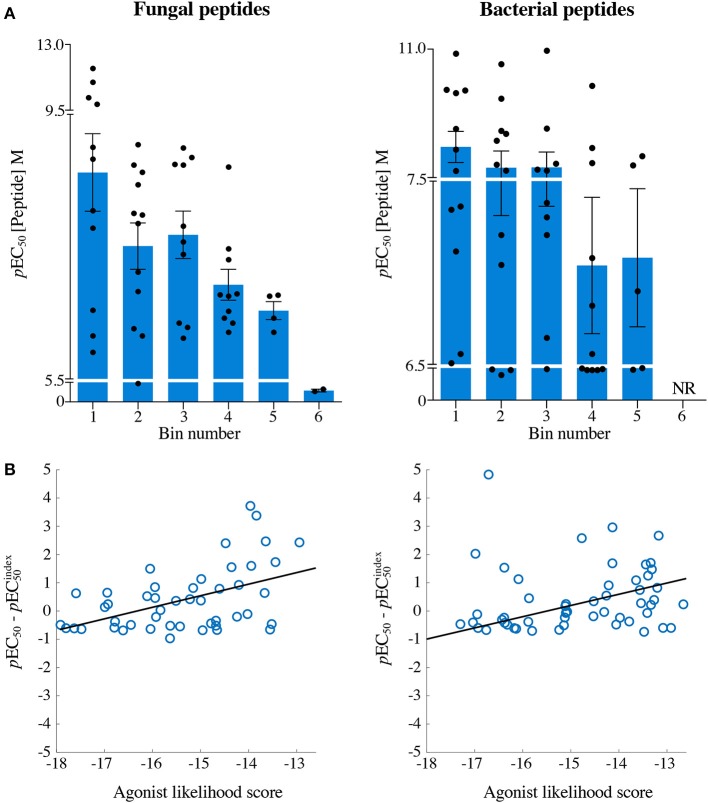
Figure 7.
The agonist likelihood score is able to identify fungal and bacterial peptide agonists. (A) pEC50 values of InsB4 clone activation towards randomly sampled peptides shown in Figures 5, 6. NR, no T-cell response. Solid bars depict the mean and error bars the SEM. (B) Scatter plot of relative functional sensitivity (ΔpEC50) for the 72 fungal and 72 bacterial randomly sampled peptides shown in Figures 5, 6 vs. agonist likelihood score.

