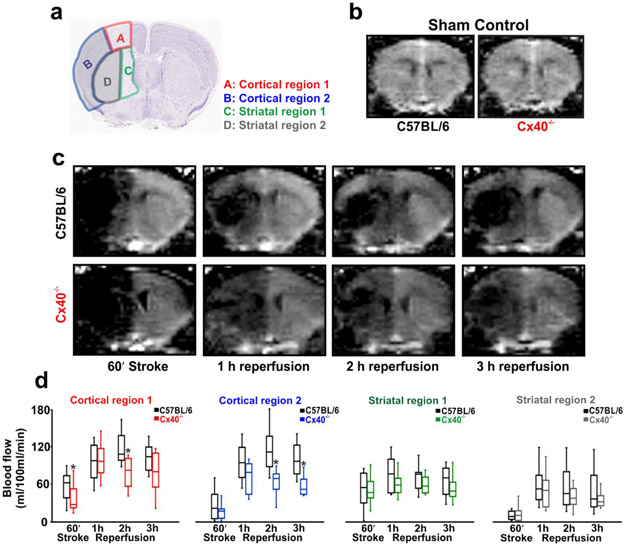
Figure 6: The initial blood flow response to stroke is attenuated in Cx40−/− mice.
(a) Perfusion was monitored during and following stroke in four regions of interest: cortical region 1 (A), cortical region 2 (B), striatal region 1 (C) and striatal region 2 (D) (Image credit: Allen Institute). Anatomically, regions B and D are supplied by the middle cerebral artery whereas regions A and C are watershed regions supplied by the middle, and the anterior or the posterior cerebral arteries. (b) ASL-MR perfusion images demonstrate that blood flow is similar in the cortex of sham controlled C57BL/6 and Cx40−/− mice (U =2, P>0.05, Mann-Whitney U test; C57BL/6, n = 4 mice; Cx40−/−, n = 4 mice) and in striatum (U =3, P>0.05, Mann-Whitney U test; C57BL/6, n = 4 mice; Cx40−/−, n = 4 mice). (c) ASL-MR perfusion images from C57BL/6 and Cx40−/− mice during stroke and reperfusion. (d) Summary data and quantitative non-parametric analysis of blood flow responses to stroke and reperfusion in C57BL/6 and Cx40−/− mice. In comparison to control mice, a significant decline in blood flow was observed in Cx40−/− mice, during stroke in cortical region 1: (U = 24, P<0.05, Mann-Whitney U test; C57BL/6, n = 9 mice; Cx40−/−, n = 10 mice), during 2 h reperfusion in cortical region 1: (U = 13, P<0.05, Mann-Whitney U test; C57BL/6, n = 9 mice; Cx40−/−, n = 10 mice); cortical region 2 (U = 5, P<0.05, Mann-Whitney U test; C57BL/6, n = 9 mice; Cx40−/−, n = 10 mice) and during 3h reperfusion in cortical region 2 (U = 5, P<0.05, Mann-Whitney U test; C57BL/6, n = 9 mice; Cx40−/−, n = 10 mice). * denotes significant difference between groups.

