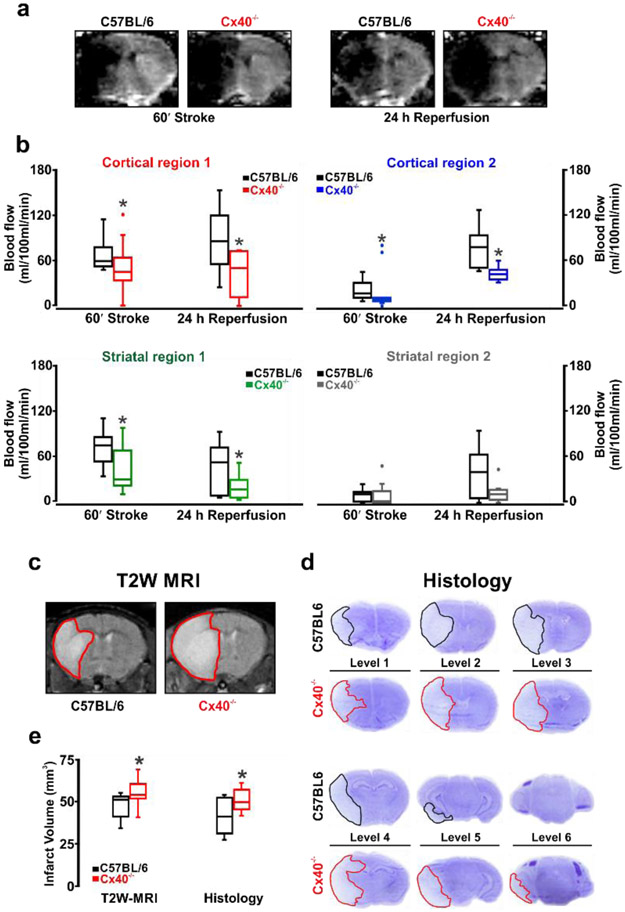
Figure 7: The prolonged blood flow response to stroke is attenuated in Cx40−/− mice, augmenting tissue injury.
Perfusion was monitored by ASL-MR during stroke (60 min) and reperfusion (24 h) in four regions of interest: cortical region 1&2 and striatal region 1&2 (see Figure 5). (a) ASL-MR perfusion images from C57BL/6 and Cx40−/− mice during stroke and 24 h reperfusion. (b) Summary data and quantitative non-parametric analysis of blood flow responses to stroke and 24h reperfusion in C57BL/6 and Cx40−/− mice. A significant decline in blood flow was observed in Cx40−/− mice, during stroke in cortical region 1 (U = 21, P<0.05, Mann-Whitney U test; C57BL/6, n = 9 mice; Cx40−/−, n = 9 mice); in cortical region 2 (U = 17, P<0.05, Mann-Whitney U test; C57BL/6, n = 9 mice; Cx40−/−, n = 9 mice); in striatal region 1 (U = 21, P<0.05, Mann-Whitney U test; C57BL/6, n = 9 mice; Cx40−/−, n = 9 mice) and during 24 h reperfusion in cortical region 1 (U = 17, P<0.05, Mann-Whitney U test; C57BL/6, n = 9 mice; Cx40−/−, n = 9 mice); in cortical region 2 (U = 6, P<0.05, Mann-Whitney U test; C57BL/6, n = 9 mice; Cx40−/−, n = 9 mice) and in striatal region 1 (U = 20, P<0.05, Mann-Whitney U test; C57BL/6, n = 9 mice; Cx40−/−, n = 9 mice). (c, d) T2 weighted MR imaging and cresyl violet staining of brain injury following 24 h reperfusion in C57BL/6 and Cx40−/− mice. (e) Summary data and non-parametric analysis of tissue injury in animals subjected to stroke and 24 h reperfusion (T2 weighted imaging: U = 19.50, P<0.05, Mann-Whitney U test; C57BL/6, n = 9 mice; Cx40−/−, n = 9 mice), (cresyl violet: U = 18, P<0.05, Mann-Whitney U test; C57BL/6, n = 9 mice; Cx40−/−, n = 8 mice). Edema volume was not different between the two animal groups. * denotes significant difference between groups.

