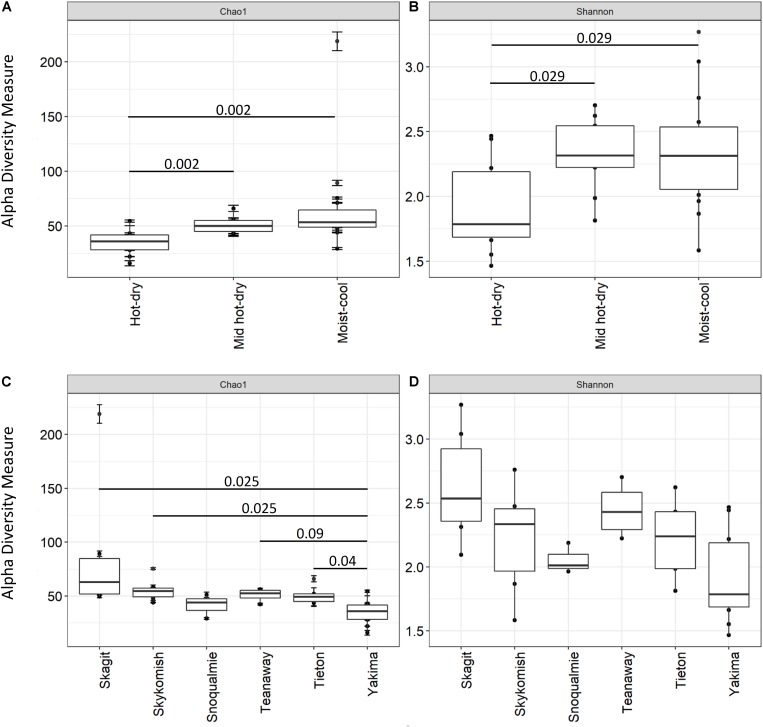
FIGURE 3.
Comparison of Alpha diversity indices Chao 1 and Shannon across hot-dry, mid hot-dry and moist-cool climatic zones (A,B) and between sampling sites (C,D), i.e., Yakima, Skagit, Tieton, Teanaway, Snoqualmie, Skykomish. Only significant Benjamini–Hochberg adjusted P-values are shown. For completeness all adjusted P-value from pairwise comparison were added to Supplementary Table S6.

