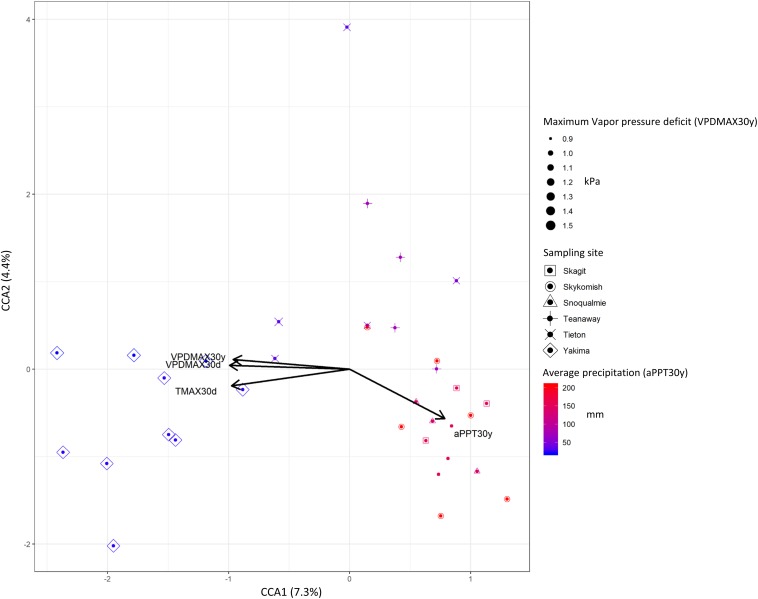
FIGURE 5.
Canonical constrained analysis (CCA) biplot relating community composition to climate and weather variables. The percent of variation explained by each axis is indicated in parentheses. Symbols size and color gradient represents 30 years climate data maximum vapor (VPDMAX30y) pressure deficit and average precipitations (aPPT30y).

