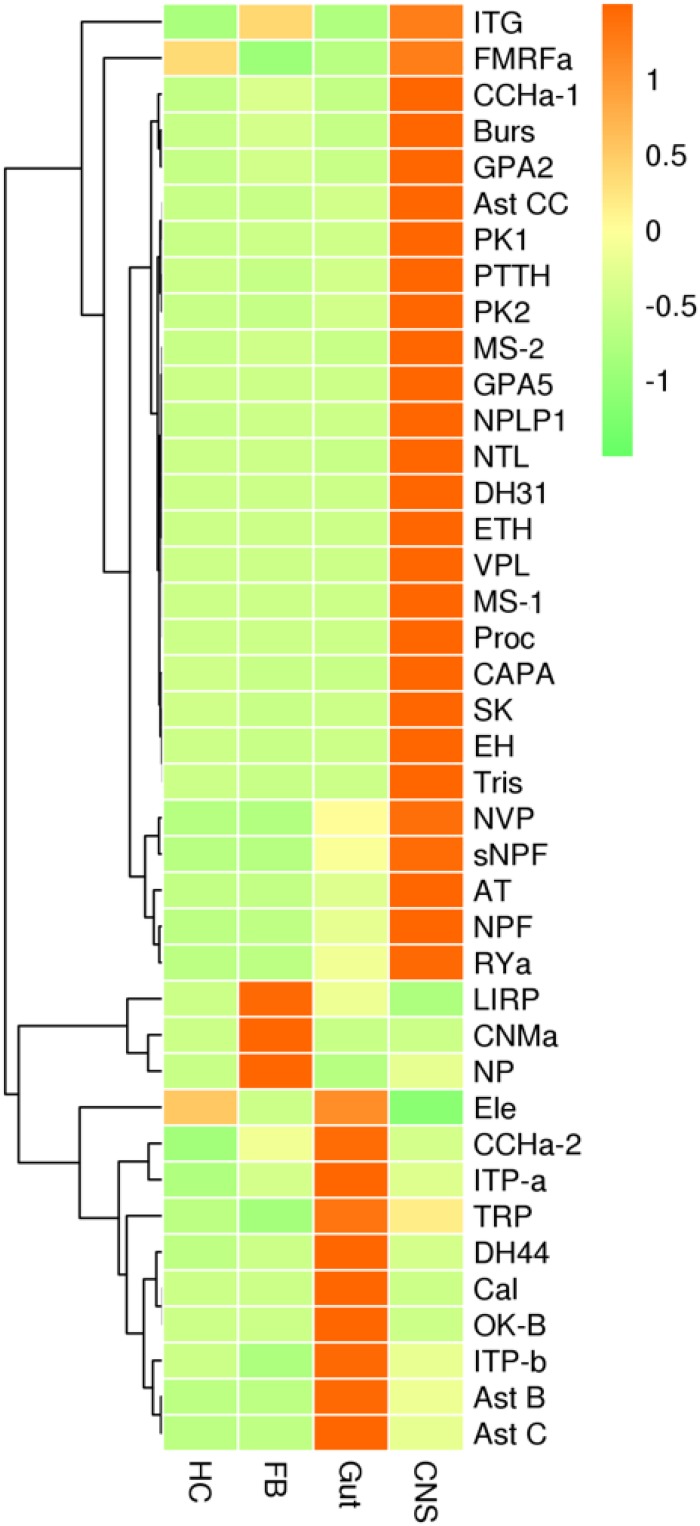
FIGURE 5.
qRT-PCR results showing the relative expression levels of the neuropeptide precursors in various tissues of the red palm weevil. HC, hemocytes; FB, fat bodies; Gut, including foregut, midgut, hindgut, and Malpighian tubes; CNS, central nervous system. The expression levels were estimated using the 2– Δ CT method. Red indicates overexpression, while green represents low expression.

