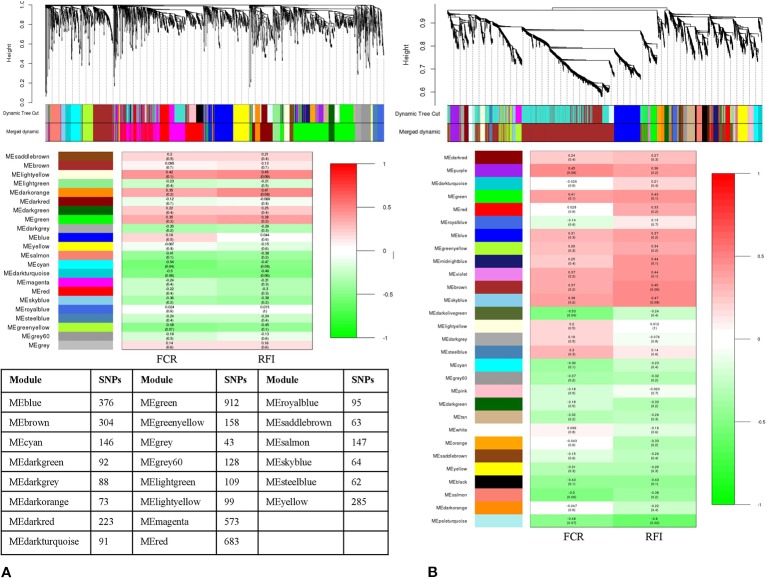
Figure 5.
Dendrogram and module-trait correlation plots in A: Landrace low and B: Landrace high feed efficient groups. Upper panel of each plot (A, B) represents SNP-clustering dendrogram obtained by hierarchical clustering of TOM-based dissimilarity with the corresponding module colors indicated by the color row. Each colored row represents color-coded module that contains a group of highly connected SNPs. The middle panel of each plot (A, B) represents the module trait correlation, where the x-axis represents feed conversion ratio (FCR) in the first column and residual feed intake (RFI) in the second column; the y-axis represents the modules. The color-code in the module-trait correlation plots is based on Pearson’s correlation (p-values in parenthesis). Positive and negative correlations are shown in red and green colors, respectively. The lower panel represents the number of SNPs clustered in each module.

