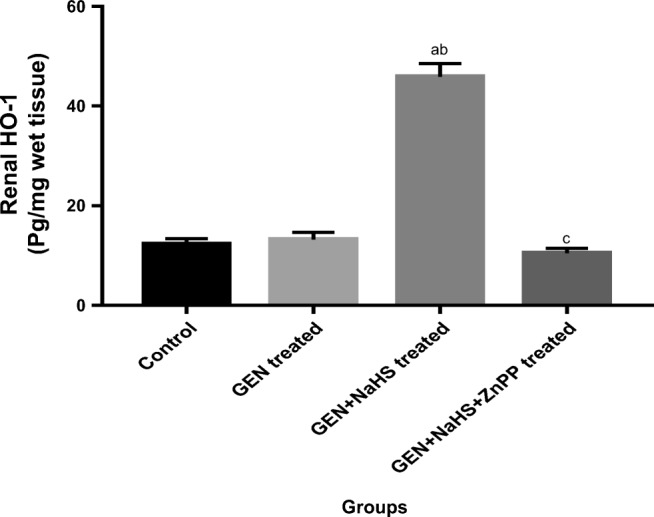
Fig. 3.

Changes in renal HO-1 level in the different experimental groups. Data represent mean ± SEM of 8 rats. a Significantly different from the control group. b Significantly different from the GEN-treated group. c Significantly different from the GEN + NaHS–treated group. P ˂ 0.05. GEN gentamicin, NaHS sodium hydrosulfide, ZnPP zinc protoporphyrin IX, HO-1 heme oxygenase 1
