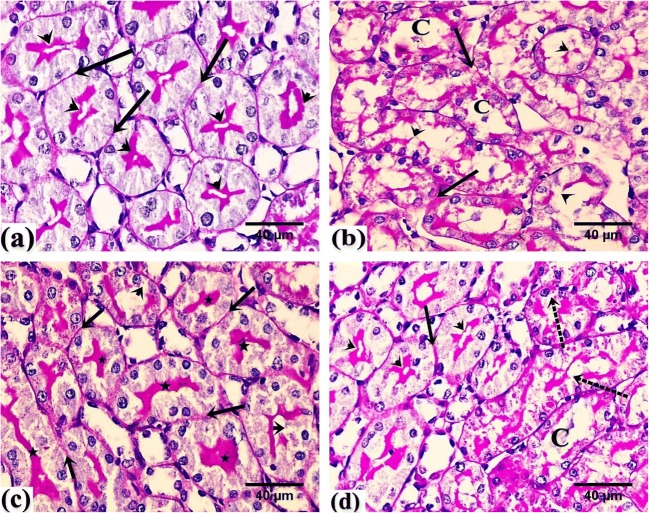
Fig. 5.
Photomicrographs of rats’ renal tissue. a From the control group showing positive PAS reaction along the regular basement membrane (arrow) and the intact brush borders (arrowhead) of renal PCTs. b From the GEN group showing faint PAS reaction along the basement membrane (arrow) and along the disrupted brush border of renal tubules (arrowhead). Note the stained cast within the tubules (C). c From the GEN + NaHS–treated group showing positive PAS reaction along the regular basement membrane (arrow) and the intact brush borders (star) of renal PCTs. Note the disrupted brush border of renal tubules (arrowhead). d From the GEN + NaHS + ZnPP–treated group showing positive PAS reaction along the regular basement membrane (arrow) and the intact brush borders (arrowhead) of renal PCTs. Note the disrupted brush border of renal tubules (dotted arrow) and the stained cast within the tubules (C). PAS, counterstained with H, × 400

