Fig. 3.
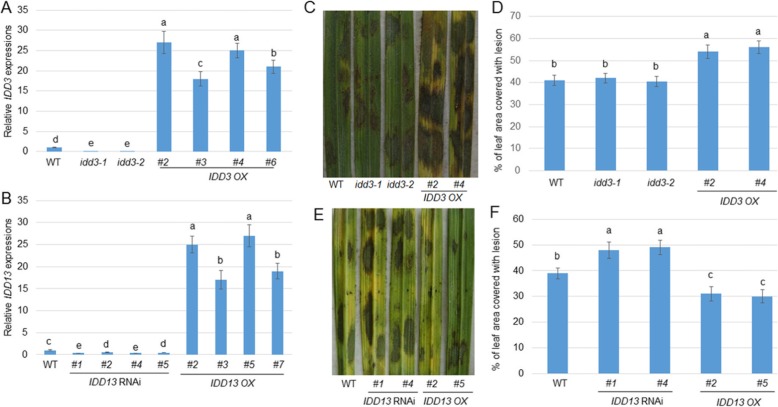
Response of IDD3 and IDD13 mutants to sheath blight (Rhizoctonia solani). aIDD3 expression level was examined in the wild-type, the idd3 mutants (idd3–1 and idd3–2), and IDD3 OX (#2, #3, #4, and #6) plants. The error bars are the mean ± SE (n = 3). b IDD13 expression level was detected in the wild-type, IDD13 RNAi (#1, #2, #4, and #5), and IDD13 OX (#2, #3, #5, and #7) plants. The error bars are the mean ± SE (n = 3). c Response of the idd3 mutants and IDD3 OX (#2 and #4) plants to R. solani AG1-IA compared with the wild-type (WT). d Percentage of leaf area covered with lesions in the lines shown in (c). Data represent the means ± SE (n > 10). e Response of IDD13 RNAi (#1 and #4) and IDD13 OX (#2 and #5) plants to R. solani AG1-IA compared with the wild-type (WT). f Percentage of leaf area covered with lesions in the lines shown in (e). Data represent the means ± SE (n > 10). Different letters indicate significant differences at P < 0.05

