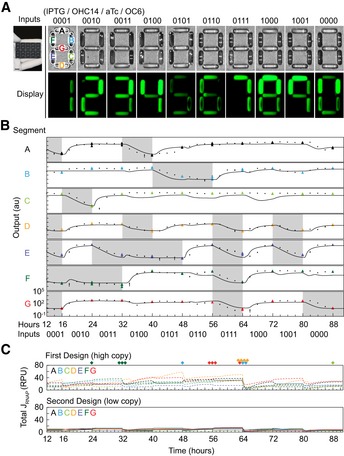
Figure 3. Performance of the 7‐segment circuit.

- Escherichia coli displaying the digits 0–9. Cells containing each circuit (A–G) are induced and loaded into the well marked with that letter (Materials and Methods). The 3D‐printed display is shown in the inset, and a high‐resolution image is provided in Appendix Fig S16. The top row shows the sensors that are on for each of the digits (inputs are in order 4/3/2/1 and correspond to P Tac (0.2 mM IPTG)/P Cin (1 μM OHC14)/P Tet (2 ng/ml aTc)/P Lux2 (0.1 μM OC6). The quantity of bacteria added to each well is as follows: 0.77, 1.22, 0.13, 1.16, 0.18, 0.88, and 0.80 (×109 CFU/20 μl) (cells A–G). This is to account for variation in the magnitude of the OFF/ON states of the different circuits (see Fig 2F).
- Dynamics of circuit performance as they are transitioned from 0 → 1 → 2 → 3 … 8 → 9 → 0. Colored triangles correspond to time points taken every 8 h over a continuous time course (Materials and Methods). The black points show individual experiments that start at one digit and stop at the next to fill in points between transitions at 2‐h resolution. Gray regions in the trajectory show those portions of the time course where the output of that segment should be in the OFF state to make the correct digit. The line shows the predicted response based on a set of ODEs and the kinetic parameters for the sensors, gates, and YFP production (Appendix Information). The data points are the average of three experiments performed on different days, and the error bars are the standard deviation of these measurements.
- The total flux of RNAP is calculated for all of the promoters in the genetic circuit using the dynamic model. The calculation is performed over the 88‐h time course, switching between digits as above. “High Copy” refers to an earlier design for the 7‐segment circuits based on a mutant backbone that increased copy number (see text and Appendix Fig S14 for details). “Low Copy” refers to the circuits shown in Fig 2. The diamonds at the top of the graphs show when the circuit failed to produce the correct output to make the desired digit (Appendix Fig S14).
