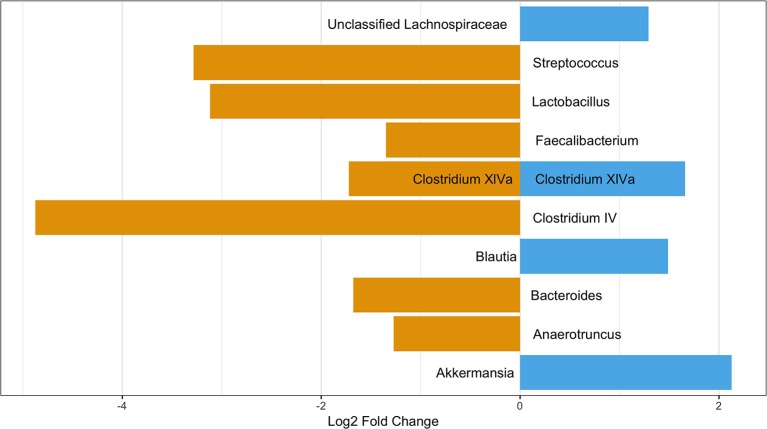
Figure 6.
OTUs significantly differentially abundant between those with and without pets. Positive values represent OTUs more abundant in those with pets and negative values represent OTUs more abundant in those with not pets. The Benjimini-Hochberg correction for the false discover rate was applied.

