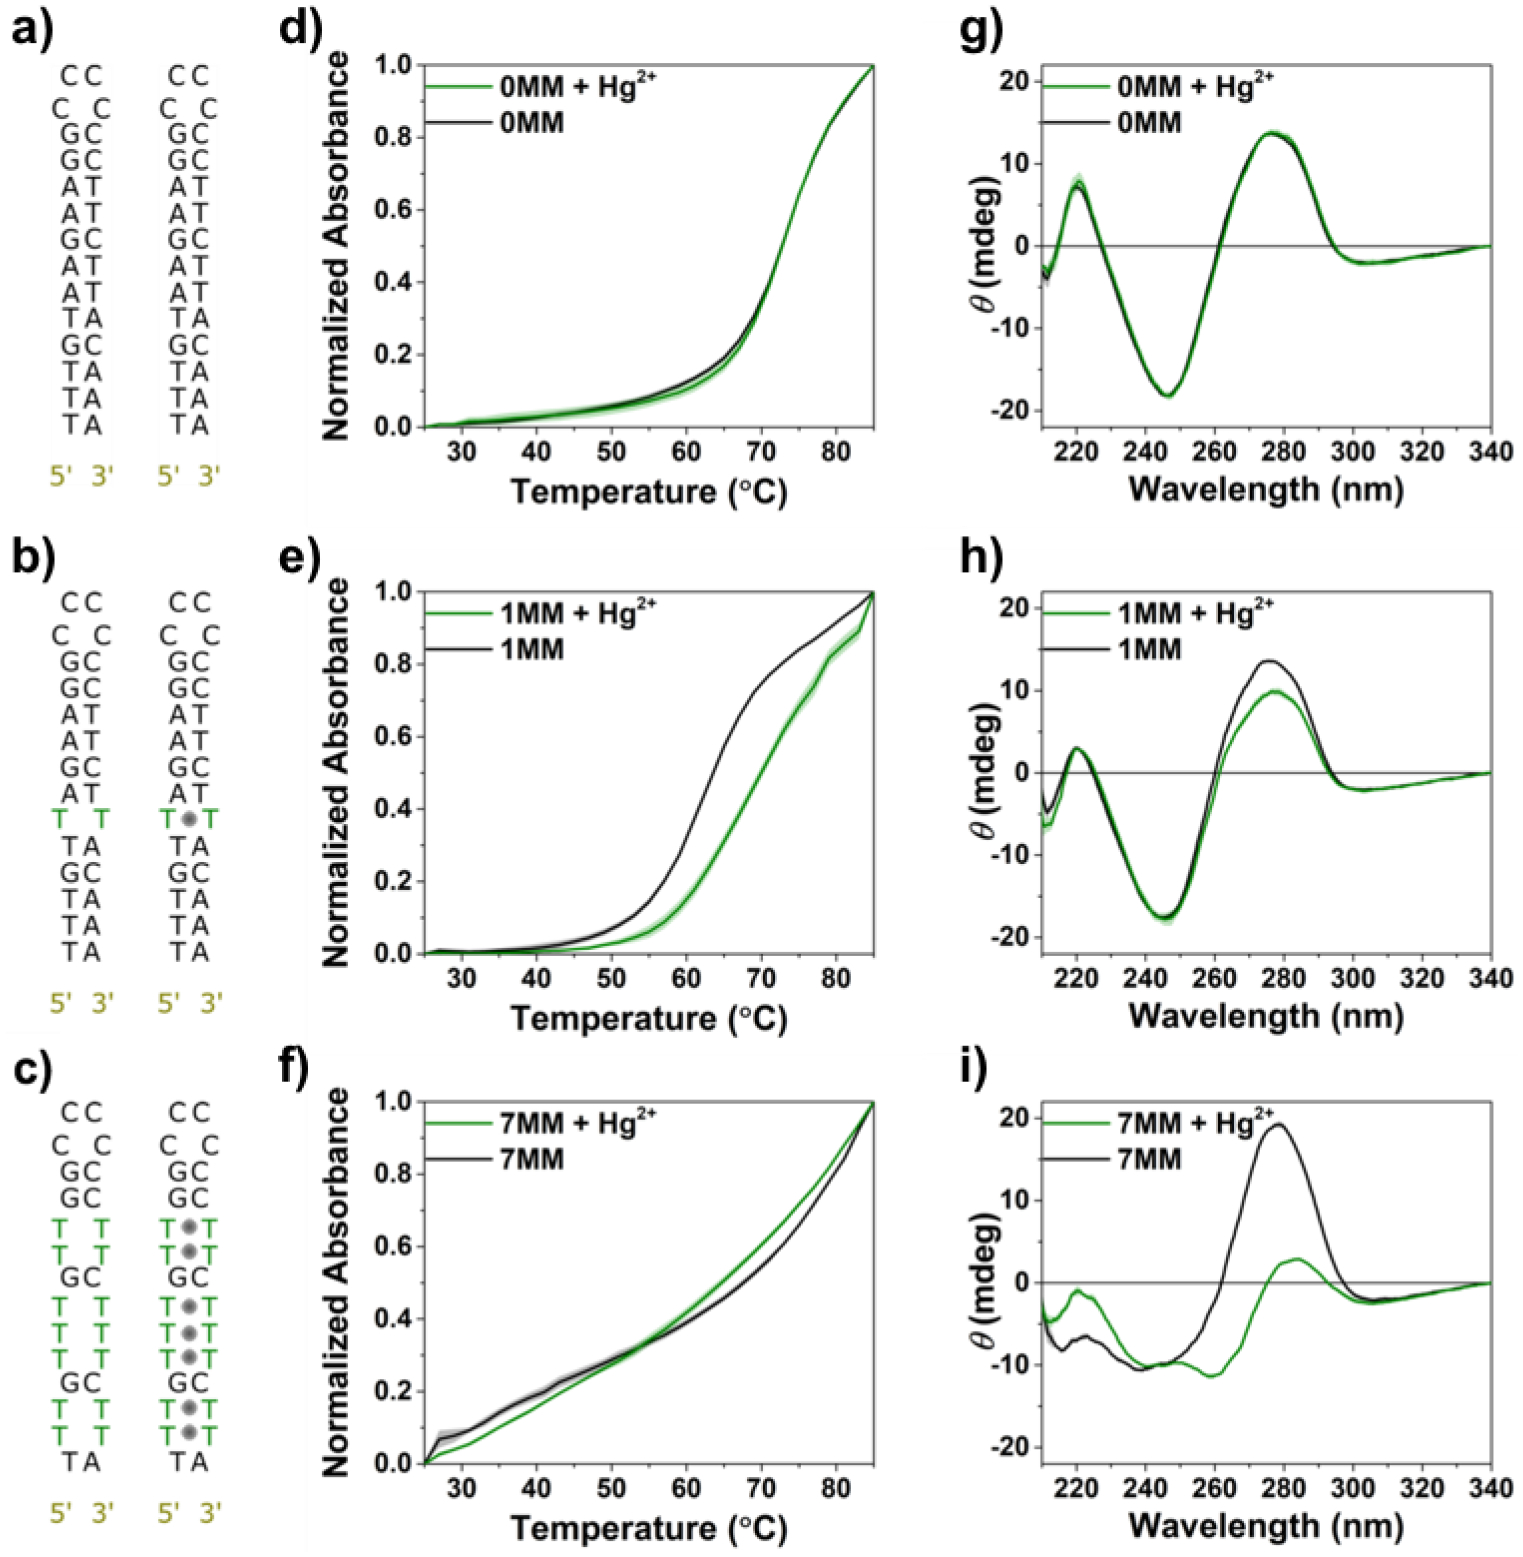
Figure 2.

a-c) Schematics of DNA with 0 thymine-thymine mismatches (0MM), 1MM, and 7MM, respectively, illustrating number of thymine-thymine mismatches (left), and of the same sequences in the presence of Hg2+ ions (represented as solid grey circles). d-f) Melting curves for 0MM, 1MM, and 7MM. Peak absorbance at 260 nm is normalized to the maximum value for each curve. g-i) Circular dichroism spectra for 0MM, 1MM, and 7MM. Melting curves and circular dichroism were collected for each sequence in the presence (green) or absence (black) of stochiometric Hg2+. The concentration of all DNA solutions was 5 μM. Shaded areas represent standard errors of the mean (N = 3).
