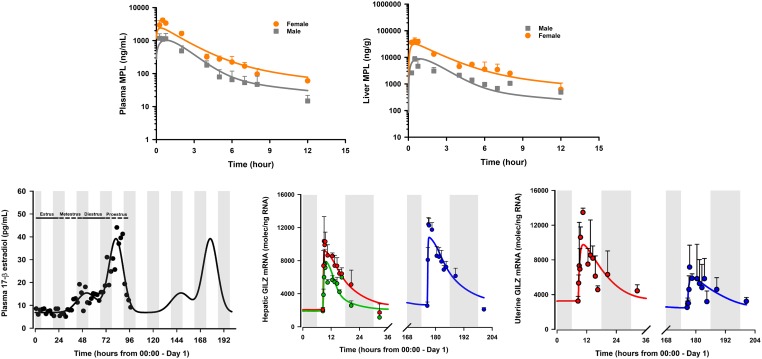
Fig. 9.
Model fittings of the concentration-time profiles of total MPL in plasma (top left) and liver (top right) of male and female rats that received 50 mg/kg i.m. doses of MPL. Shown on the (bottom left) is the plasma concentration-time profile of E2 in female rats over the 4-day estrous cycle; symbols are measurements from individual rats, and the solid line depicts the model-fitted profile shown to repeat for a second cycle. (Bottom middle) depicts GILZ mRNA in liver from male rats (green), estrus-phased female rats (red), and proestrus-phased female rats (blue) given 50 mg/kg i.m. MPL. The GILZ mRNA in uterus from estrus-phased female rats (red) and proestrus-phased female rats (blue) given 50 mg/kg i.m. MPL is shown (bottom right). Symbols represent the mean ± S.D. Dark (shaded) and light (unshaded) periods are indicated. Figure adapted from (Ayyar et al., 2019a and 2019b).

