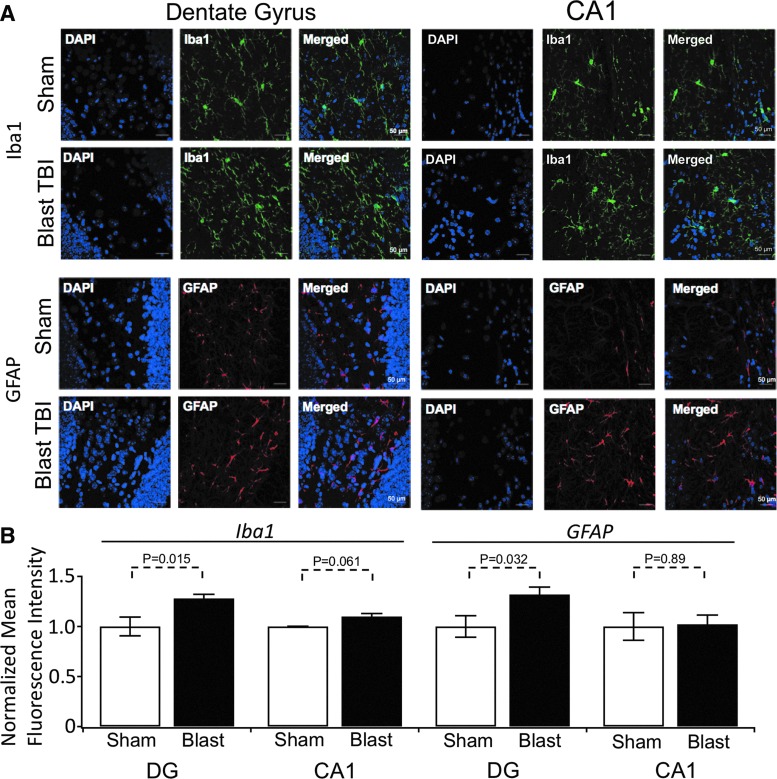
FIG. 5.
Quantification of ionized Ca2+ binding adaptor molecule 1 (Iba-1) and glial fibrillary acidic protein (GFAP) immunohistochemisty using mean fluorescence intensity analysis. (A) Representative maximum projection images of Iba-1 (top) and GFAP (bottom) labeled optical sections collected from the hippocampal dentate gyrus (left) and CA1 (right) regions of mice receiving sham or blast traumatic brain injury (TBI). Background has been subtracted. Scale bar (50 microns) is shown in the bottom right of each image. (B) Histogram of the average fluorescent intensity values for dentate gyrus (DG) and CA1 regions (fluorescence intensity was integrated for individual experiments). Values were the following for: Iba1 DG staining, sham 1.0 ± 0.09, n = 4, blast 1.28 ± 0.04, n = 6; Iba1 CA1 staining, sham 1.0 ± 0.002, n = 3, blast 1.1 ± 0.03, n = 6. For GFAP DG staining, sham 1.0 ± 0.11, n = 4, blast 1.32 ± 0.07, n = 6; GFAP CA1 staining, sham 1.0 ± 0.14, n = 3, blast 1.0 ± 0.09, n = 6. p values are shown above the plots.

