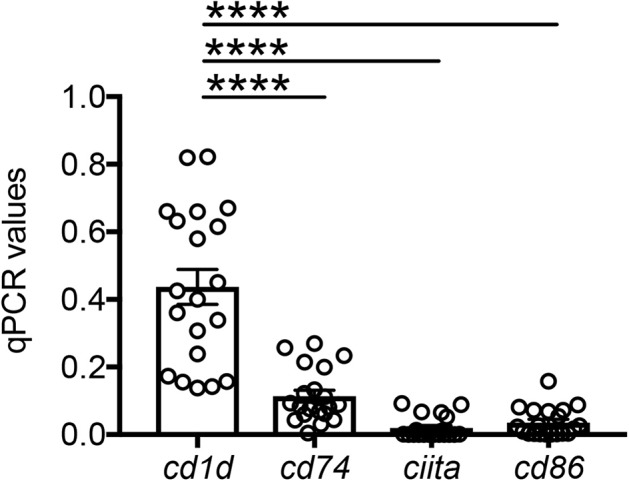
Figure 6.

Detection of CD1d and MHC class II expression on the adipocytes by qPCR. Adipocytes were sonicated for cell disruption in the presence of TRIzol to separate the soluble fraction (used for RNA isolation) from lipids and cell debris. Results show qPCR values (ΔCt) of cd1d, cd74, ciita, cd86. Mean comparisons between groups were performed by one-way ANOVA. ****p < 0.0001.
