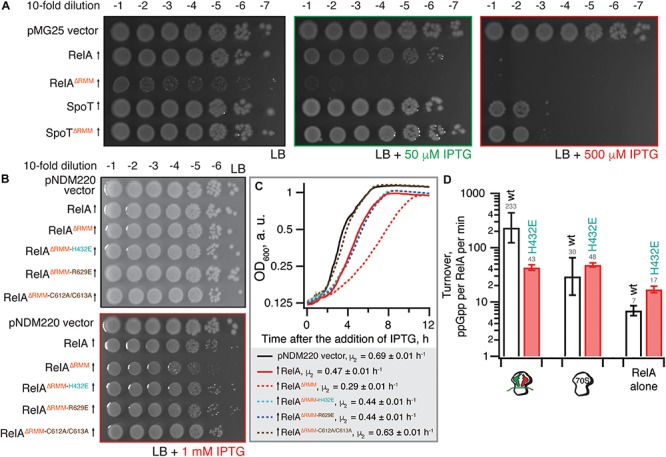
FIGURE 2.

The toxicity of ΔRRM E. coli RelA is mitigated by mutations compromising interactions with tRNA and the ribosome. (A) Wild-type E. coli BW25113 cells were transformed with either the empty high-copy IPTG-inducible pMG25 plasmid vector or pMG25-based constructs expressing wild-type and ΔRRM versions of E. coli RelA and SpoT. Up-pointing arrows indicate induction of expression. Ten-fold serial dilutions of overnight LB cultures were made and spotted onto LB agar supplemented with 100 μg/mL ampicillin and either 0, 50, or 500 μM IPTG. The plates were incubated at 37°C and scored after 18 h. (B) E. coli BW25113 cells were transformed either with the empty low-copy IPTG-inducible pNDM220 vector or pNDM220-based constructs expressing wild-type and mutant versions of E. coli RelA as indicated on the figure. Ten-fold serial dilutions of overnight LB cultures were made and spotted onto LB agar supplemented with 30 μg/mL ampicillin and 1 mM IPTG. As a plating control the same dilutions of the overnight cultures were spotted on LB agar supplemented with 30 μg/mL ampicillin but no IPTG. The plates were incubated at 37°C and scored after 18 h. (C) Thousand-fold dilutions of the same overnights were made in LB supplemented with 30 μg/mL ampicillin and 1 mM IPTG, and growth at 37°C was monitored using the Bioscreen C growth curve analysis system. The growth rates (μ2) were calculated from three independent measurements and the error bars represent standard errors. (D) H432E TGS E. coli RelA is not activated by deacylated tRNA on the ribosome. The synthetase activity of 30 nM wild type and H432E E. coli RelA was assayed in the presence of 1 mM ATP, 300 μM 3H GDP and 100 μM ppGpp in HEPES:Polymix buffer, pH 7.5, 37°C, 5 mM Mg2+. As indicated on the figure, the reaction mixture was supplemented either with 2 μM vacant 70S ribosomes or with an in situ assembled starved ribosomal complex (2 μM vacant 70S combined with 2 μM mRNA(MV), 2 μM E. coli tRNAifMet and 2 μM E. coli tRNAVal). The error bars represent standard deviations of the turnover estimates by linear regression using four data points.
