
Figure 4. The number of features used by the support vector machine classifier (top panels) and corresponding classification performance (bottom panels) varies with the hyperparameter C.
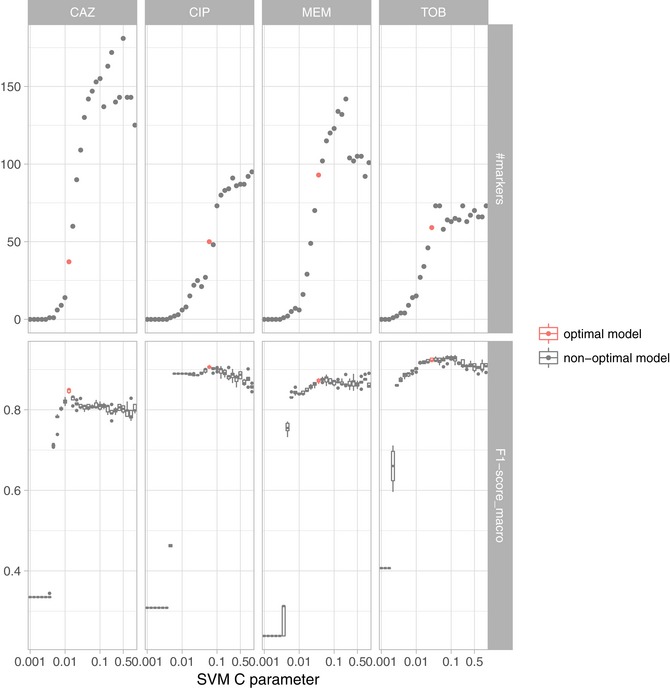
The C parameter is inversely related to the number of markers being included in the model, i.e., lower values for the C parameter yield models with less features. The SVM resistance/susceptibility classifier was evaluated in five repeats of 10‐fold nested cross‐validation. Each panel depicts the results for a different drug (CAZ, CIP, MER, and TOB) based on the best data type combination (GPA+EXPR/SNPs). The model with the fewest features within one standard deviation of the maximal performance was selected as the most suitable diagnostic classification model (red) (Dataset EV5). The solid vertical line in the box plots represents the median, the box limits depict the 25th and 75th percentile, and the lower and upper hinges include values within ± 1.5 times the interquartile range. Values outside that range were plotted as solid dots.