
Figure 5. Performance of the support vector machine (SVM) classifier for antimicrobial resistance and susceptibility prediction for different data types, different drugs, and different evaluation schemes.
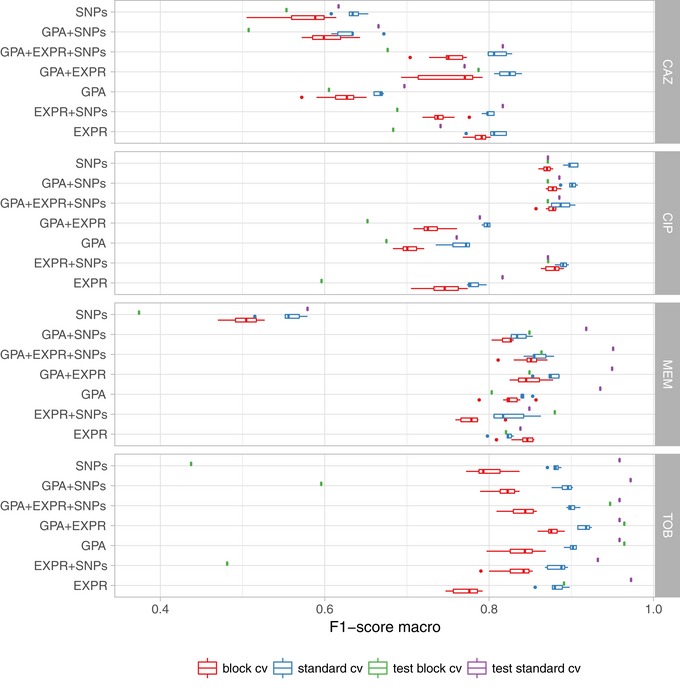
The SVM performance was summarized by the F1‐score and is shown for standard cross‐validation (standard_cv, blue) and cross‐validation using phylogenetically related blocks of isolates (block_cv, red) based on the training dataset (80% of the isolates) and for the validation dataset (green; 20% of the isolates). EXPR: gene expression; GPA: gene presence and absence with indel information. SNPs: short nucleotide polymorphisms. The solid vertical line in the box plots represents the median, the box limits depict the 25th and 75th percentile, and the lower and upper hinges include values within ± 1.5 times the interquartile range. Values outside that range were plotted as solid dots.