
Figure 6. Classification performance improves and plateaus with the number of training samples used.
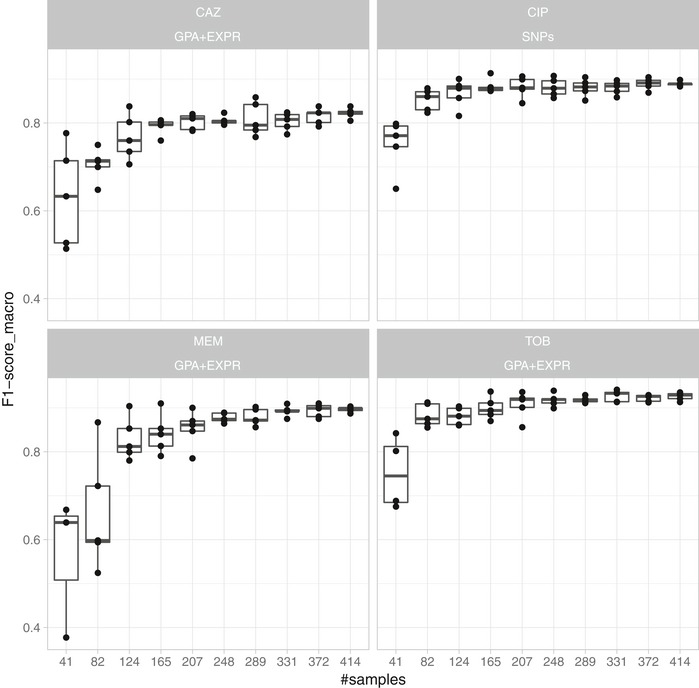
A support vector machine‐based resistance/susceptibility classifier was trained on differently sized and randomly drawn subsamples from our isolate collection and evaluated in five repeats of a 10‐fold nested cross‐validation. Each panel depicts the results for a different drug (CAZ, CIP, MEM, and TOB) based on the best data type combination (GPA+EXPR/SNPs). The solid vertical line in the box plots represents the median, the box limits depict the 25th and 75th percentile, and the lower and upper hinges include values within ± 1.5 times the interquartile range. Values outside that range were plotted as solid dots.