
Figure 2. Changes in gene expression exacerbate with aging in APPtg but not in TAUtg mice.
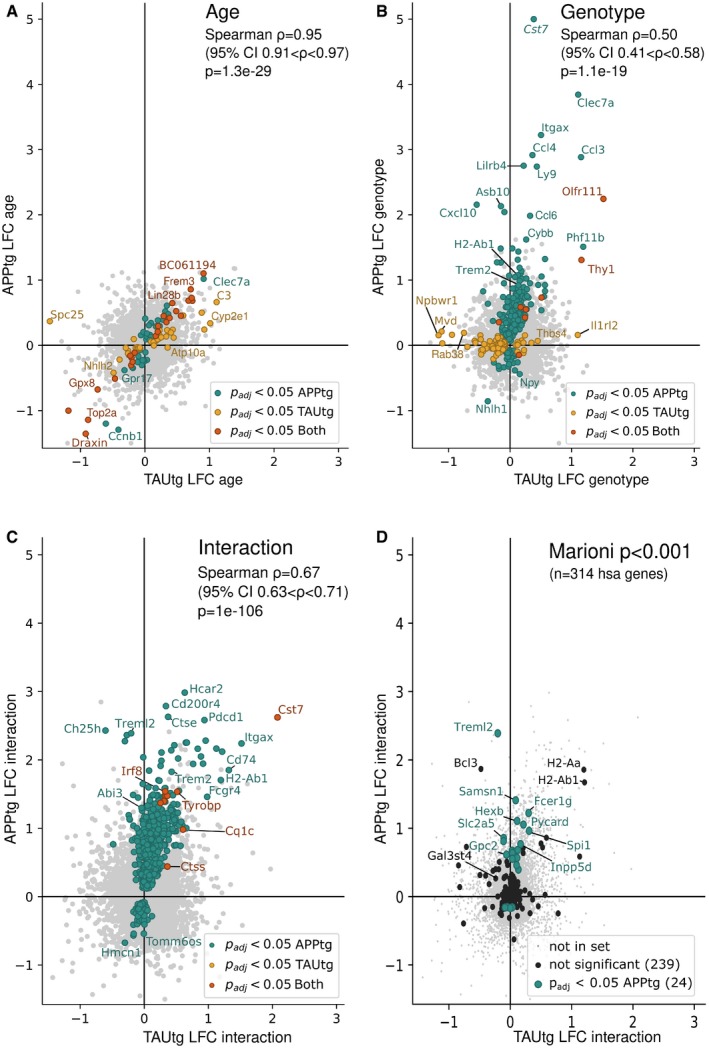
Log2 fold change (LFC) in TAUtg (x‐axis) and APPtg mice (y‐axis) after differential expression analysis. Upregulated genes are on the right part (TAUtg mice) or upper part (APPtg mice) of the graph; downregulated genes are on the left part (TAUtg) or lower part (APPtg) of the graph. Colored dots represent significantly differentially expressed genes (Benjamini–Yekutieli‐adjusted P‐values (P
adj) < 0.05) for APPtg (green dots), TAUtg (yellow dots), or for both (red dots). Spearman correlation assesses the correlation between APPtg and TAUtg mice when ranking genes that are significantly differentially expressed in either APPtg or TAUtg mice from most up‐ to most downregulated on a combined score of LFC and P
adj (i.e., signed log10(P‐value), where the sign is determined by the LFC).
-
AGenes differentially expressed as a function of age, i.e., 4M versus 10M, independently of genotype. Thus, genes with a positive LFC are more highly expressed in 10M mice over 4M mice.
-
BGenes differentially expressed due to genotype, i.e., WT versus TG, independently of age. Thus, genes with a positive LFC are more highly expressed in TG mice than in WT mice.
-
CGenes differentially expressed in the age*genotype interaction comparison, i.e., comparing the TG‐10M mice to all other experimental groups (see Fig 1C). Thus, genes with a positive LFC are more highly expressed in the TG‐10M mice compared to all other experimental groups.
-
DDepicts the 314 Marioni‐based GWAS genes at P < 0.001 onto the LFC/LFC plot of the age*genotype comparison (panel C). Green dots are significantly changed.