-
A–C
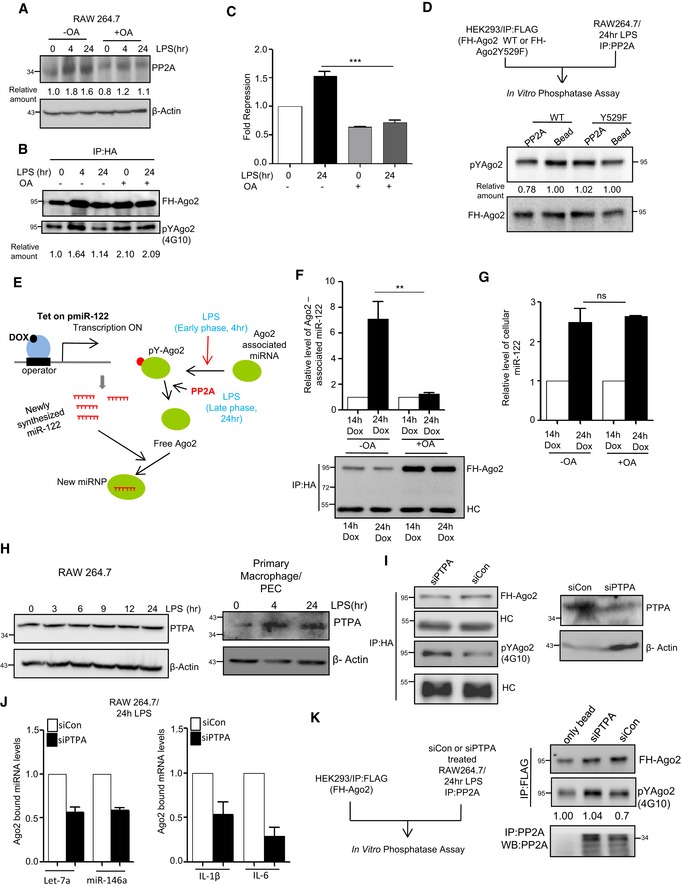
Effect of okadaic acid (OA; 100 nM), the PP2A inhibitor, on Ago2 phosphorylation and miRNA activity. Expression of PP2A was detected in Western blot done for cell extract from control and OA‐treated RAW 264.7 cells after LPS stimulation (A). The amount of phosphorylated Ago2 was measured in OA‐treated cells before and after LPS stimulation. The amount of Tyr phosphorylated Ago2 was measured by densitometric quantification of Western blot data upon normalization against immunoprecipitated Ago2 amount (B). Changes in fold repression for a let‐7a reporter upon LPS exposure in control and OA‐treated cells (mean ± s.e.m., n = 3) (C).
-
D
Schematic representation of the in vitro phosphatase assay (upper panel). PP2A was immunoprecipitated from 24‐h LPS‐treated RAW 264.7 cells and was incubated in vitro with wild type or phosphorylation defective FH‐Ago2 mutant (Ago2Y529F) isolated from HEK293 cells transfected with respective expression constructs. Phosphorylated Ago2 (pYAgo2) levels were measured by Western blot analysis using anti‐phosphotyrosine‐specific 4G10 antibody. Relative intensities were quantified by densitometric analysis and mentioned below the respective panels. FH‐Ago2 was detected by anti‐HA antibody (Lower panel).
-
E–G
Defective de novo miRNP formation in cells pre‐treated with PP2A inhibitor. A schematic representation of the assay done to check the de novo miRNP formation after doxycycline (DOX)‐induced expression of miR‐122, a liver‐specific miRNA, in RAW 264.7 cells during LPS stimulation (E). Ago2‐associated (F) and total (G) miR‐122 levels were measured by qRT–PCR and normalized against immunoprecipitated FH‐Ago2 content and U6 RNA, respectively. Values obtained upon 14 h of DOX treatment were considered as unit, and relative values obtained upon 24 h of DOX treatment are plotted. All samples were treated for 24 h with LPS (mean ± s.e.m., n = 4).
-
H–K
Phosphotyrosyl phosphatase activator (PTPA) is an essential factor for PP2A‐mediated dephosphorylation of Ago2. Expression of PTPA after LPS stimulation in RAW 264.7 cells as well as in PEC isolated from BALB/c mice. β‐Actin was used as loading control (H). Effect of PTPA depletion on Ago2 phosphorylation level in RAW 264.7 cells (I). Phosphorylated Ago2 level was measured by Western blot in HA‐immunoprecipitated materials isolated from either siCon‐ or siPTPA‐transfected cells expressing FH‐Ago2 upon 24 h of LPS treatment using a phosphotyrosine‐specific 4G10 antibody (I, left panel). The PTPA was detected with anti‐PTPA antibody, and β‐actin was used as loading control (I, right panel). Effect of PTPA depletion on Ago2‐associated miRNAs and mRNAs. Ago2‐associated miRNA (J, left panel) (mean ± s.e.m., n = 3) and mRNA levels (J, right panel) (mean ± s.e.m., n = 2) were also quantified using qRT–PCR. Amount of FH‐Ago2 in immunoprecipitated materials (shown in panel I) were used for normalization. Schematic depiction of in vitro phosphatase assay (K, left panel). PP2A was immunoprecipitated from siCon‐ or siPTPA‐treated RAW 264.7 cells treated with LPS for 24 h and was incubated in vitro with FH‐Ago2 isolated from FH‐Ago2 stable HEK293 cells and upon the assay reaction, the phospho‐Ago2 level was measured by Western blot analysis using phosphotyrosine‐specific 4G10 antibody (K, right panel).
Data information: Relative quantification was done by densitometry. HC: heavy chain of respective antibodies used for immunoprecipitation. In all experimental data, ns: non‐significant and ** and *** represent
P‐value of < 0.01 and < 0.001, respectively, estimated by using Student's
t‐test. Exact
P‐values against each experimental set are presented in the
Appendix Table S2. Positions of molecular weight markers are marked and shown in the Western blots used in different panels.
Source data are available online for this figure.

