-
A–C
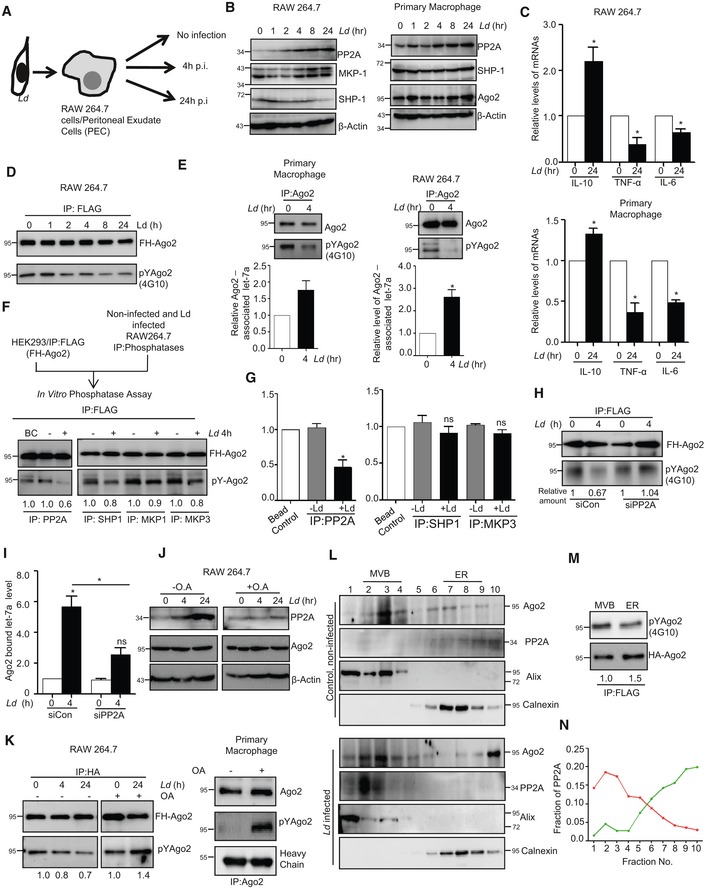
Expression of different cytokines and phosphatases in RAW 264.7 cells and PEC infected with Leishmania donovani (Ld) parasites. A scheme of the experiments is shown in panel A. Cells at different time points of infection were harvested, and levels of various phosphatases were checked by Western blot analysis using antibodies specific for different phosphatases in both RAW 264.7 (B, left panel) and mouse peritoneal macrophage cells PEC (B, right panel). Cytokine mRNA levels like IL‐10, TNF‐α and IL‐6 were quantified after 24 h of Ld infection in RAW 264.7 (C, upper panel mean ± s.e.m., n = 3) and mouse peritoneal macrophage PEC (mean ± s.e.m., n = 3) (C, Lower panel).
-
D, E
Effect of Ld infection on Ago2 phosphorylation and its miRNA association. RAW 264.7 cells were transfected with FH‐Ago2 expression construct, and infection was done for various time points followed by FH‐Ago2 pull down using anti‐FLAG beads. Phosphorylated Ago2 levels were checked during the course of Ld infection (D). Phosphorylation levels of Ago2 were measured by doing endogenous Ago2 pull down using Ago2‐specific antibody after 4 h of infection and quantified along with Ago2‐associated let‐7a level measurement in primary macrophages (mean ± s.e.m., n = 2) (E, left panel) and in RAW 264.7 cells (mean ± s.e.m., n = 3) (E, right panel).
-
F, G
Schematic representation of in vitro phosphatase assay (F, upper panel). PP2A, MKP1, MKP3 or SHP1 was immunoprecipitated individually from naïve or Leishmania‐infected macrophage cells and was incubated in vitro with FH‐Ago2 isolated from FH‐Ago2 stable HEK293 cells. Phosphorylated Ago2 level was detected by Western blot analysis using phosphotyrosine‐specific 4G10 antibody (F, lower panel) and measured by densitometry. Relative intensity of 4G10 specific band against immunoprecipitated Ago2 was plotted (mean ± s.e.m., n = 3) (G). BC: bead control.
-
H, I
Effect of PP2A knock‐down on Ago2 phosphorylation and miRNA‐Ago2 binding in RAW 264.7 cells infected with Ld. Cells were co‐transfected with siRNA and FH‐Ago2 expression plasmid. Phosphorylated Ago2 levels were detected after 4 h of infection in siCon‐ or siPP2A‐transfected cells (H). Ago2‐associated let‐7a levels were also estimated and plotted (mean ± s.e.m., n = 4) (I).
-
J, K
Effect of OA on Ago2 phosphorylation in Ld‐infected RAW 264.7 cells and mouse PEC. Cellular levels of PP2A and Ago2 at different time points of Ld infection with or without OA treatment (100 nM) were detected. Cells were pre‐treated with OA (100 nM) for 2 h before infection (J). β‐Actin was used as loading control. Phospho‐Ago2 level was measured in OA pre‐treated; Ld‐infected RAW 264.7 cells expressing FH‐Ago2 and in PEC after 24 h of infection with or without OA pre‐treatment. Phosphorylated Ago2 levels were also checked (K).
-
L–N
Subcellular compartmentalization of PP2A in Ld‐infected RAW 264.7 cells. RAW 264.7 cells were infected with Ld for 6 h, and cell extract was analysed on a OptiPrepR density gradient to separate subcellular organelles and structures. Subcellular localization of Ago2 and PP2A in individual fractions was detected by Western blots. Alix was used at MVB marker, while Calnexin was used as ER marker (L). OptiPrepR fractions, positive for MVB (fraction number 2,3,4) and ER (fraction number 7,8,9) markers, were pooled separately, and Ago2 was immunoprecipitated using anti‐FLAG beads. Phosphorylated Ago2 levels were quantified in Western blot done with phosphotyrosine‐specific 4G10 antibody (M). PP2A percentage intensity plot for each fraction was done for control (Green line) and infected (Red line) samples (N).
Data information: In all experimental data, ns: non‐significant and * represents
‐test. HC: heavy chain of respective antibody used for immunoprecipitation. Exact
. Positions of molecular weight markers are marked and shown in the Western blots used in different panels.

