-
A
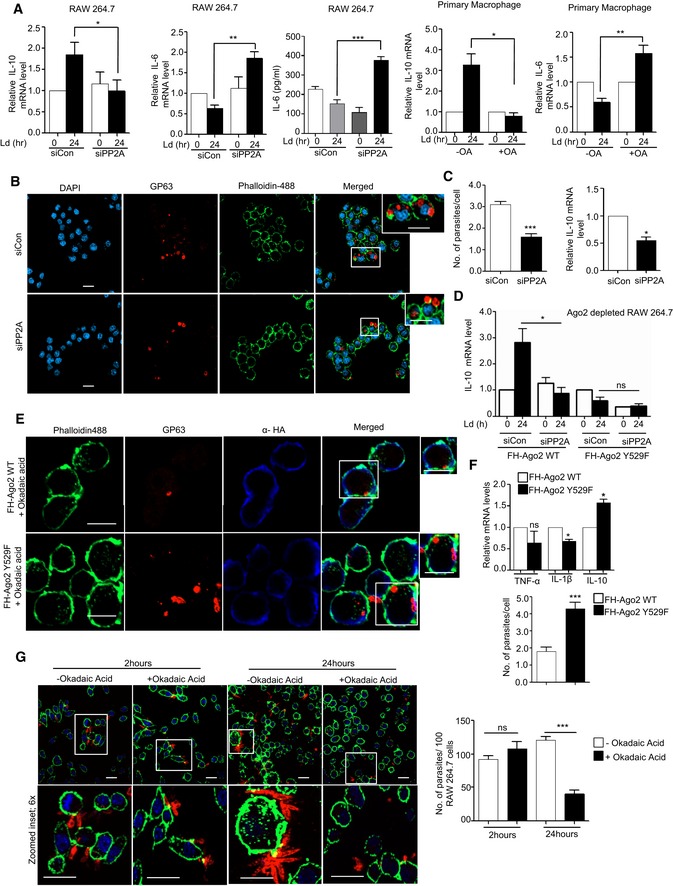
Effect of PP2A downregulation or inhibition on pro‐ and anti‐inflammatory cytokine levels in Ld‐infected macrophage. IL‐10 levels were measured after Ld infection in PP2A knocked‐down RAW 264.7 cells (mean ± s.e.m., n = 3) and in PEC (mean ± s.e.m., n = 3). IL‐6 was also measured in RAW cells after OA treatment (mean ± s.e.m., n = 5) and also in PEC pre‐treated with OA (mean ± s.e.m., n = 3). Values obtained at 0 h (non‐infected) or non‐OA treated samples were considered as unit in each case. IL‐6 protein level (n = 5) in cell supernatant was also measured by ELISA after Ld infection in PP2A knock‐down RAW 264.7 cells.
-
B, C
Effect of PP2A knock‐down on parasite internalization and cellular IL‐10 level. Internalized parasites were imaged in RAW 264.7 cells stained with Phalloidin‐Alexa 488 (green) for actin cytoskeleton detection, and Ld was detected by indirect immunofluorescence done for parasite specific membrane protein GP63 (red) (B). Number of Ld internalized was measured in control and PP2A knock‐down cells, and relative numbers of parasites within infected cells were plotted [C, left panel (mean ± s.e.m., n = 20 cells)]. IL‐10 mRNA levels were also quantified in those cells by qRT–PCR done for total cellular RNA [C, right panel (mean ± s.e.m., n = 3)]. Scale bar 20 μm. 4× Zoomed insets are shown.
-
D
Effect of PP2A knock‐down on IL‐10 level in Ld‐infected cells expressing phosphorylation defective mutant of Ago2. In RAW 264.7 cells, depleted for endogenous Ago2 (using a specific siRNA against the 3′UTR of Ago2 mRNA), either the wild type or Y529F mutant of FH‐Ago2 (without having the 3′UTR of Ago2) was expressed in siCon‐ or siPP2A‐treated RAW 264.7 cells. IL‐10 mRNA level was measured subsequent to Ld infection. Relative IL‐10 levels were plotted. Expression levels in non‐infected siCon‐treated cells in each case were designated as unit (mean ± s.e.m., n = 3).
-
E–G
Effect of PP2A inhibitor OA on Ld internalization and cytokine production in RAW 264.7 cells. In RAW 264.7 cells transfected with FH‐Ago2 WT and Y529F mutant and pre‐treated with OA, Leishmania internalization was measured microscopically. In images obtained, Ago2 was detected with α‐HA (detected at 405 nm) and Leishmania was stained for GP63 (detected at 564 nm) (E). Quantitative measurement of GP63‐positive structures was done, and quantitative data per 100 infected cells were plotted. Scale bar 10 μm. RNA was isolated from different experimental sets, and TNF‐α, IL‐1β and IL‐10 mRNA levels were estimated (mean ± s.e.m., n = 3) (F). RAW 264.7 cells with and without OA treatment were given Ld infection for 2 and 24 h. RAW 264.7 cells were stained with Phalloidin‐Alexa 488 (green) for actin cytoskeleton, and Ld was stained for parasite specific protein GP63 (red) (G, left panel). Number of internalized parasites per 100 macrophages were calculated, and relative values were plotted (G, right panel) (mean ± s.e.m., n = 20). Scale bar 20 μm.
Data information: Zoomed parts are been highlighted with white boxes in the microscopic pictures. In all experimental data, ns: non‐significant and *, ** and *** represent
P‐value of < 0.05, < 0.01 and < 0.001, respectively, quantified with the help of Student's
t‐test. For statistical analysis, all experiments are done minimum three times. Exact
P‐values against each experimental set are presented in the
Appendix Table S2. Positions of molecular weight markers are marked and shown in the Western blots used in different panels.
Source data are available online for this figure.

