-
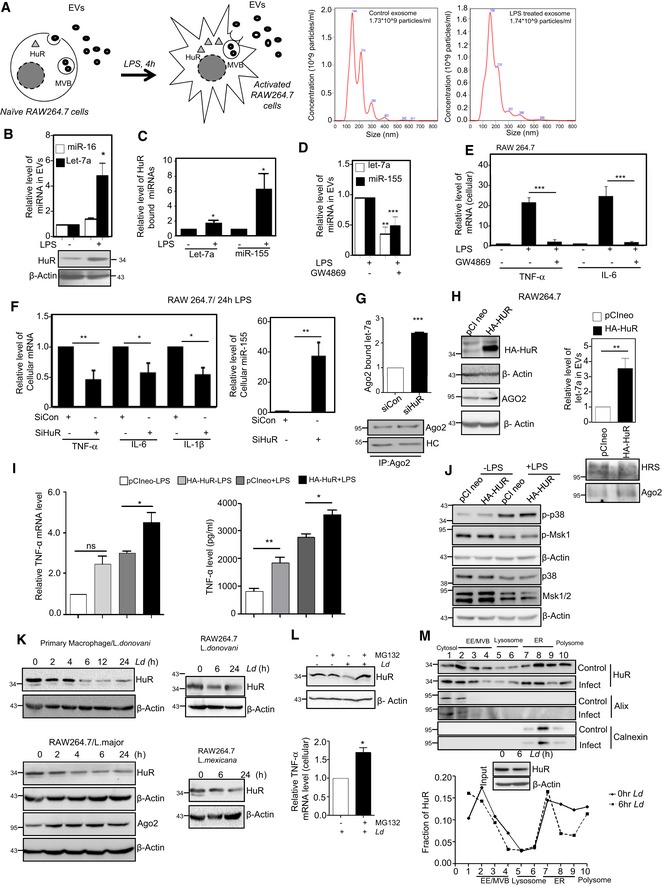
A–C
LPS induced miRNA export from mammalian macrophage cells. A schematic diagram of the experiments has been described in left panel of (A). Characterization and quantification of exosomes/EVs derived from control and LPS‐activated RAW 264.7 cells by nanoparticle tracking analysis (NTA) done for isolated exosomes/EVs. Relative size distributions are shown (A, right panel). Levels of HuR and exosomal miRNA isolated from control and 24 h of LPS‐treated RAW 264.7 cells. RNA content was normalized against total exosomal proteins (B). β‐Actin was used as loading control for HuR Western blot. Binding of miRNAs with HuR after LPS exposure was measured. Amount of RNA was normalized against HuR content. Anti‐GFP antibody was used for immunoprecipitation control (C). Values are mean ± s.e.m. and n = 3.
-
D
Effect of GW4869, the inhibitor of exosome/EV‐mediated miRNA export, on miRNA content of EVs released by LPS‐stimulated cells. The level of miRNAs, let‐7a and miR‐155 was measured in exosomes (EVs) released from LPS‐activated cell after GW4869 treatment. Values for EVs from naïve macrophages without GW4869 and LPS treatment were set as unit. Values are mean ± s.e.m. and n = 3.
-
E
Effect of GW4869 on cellular cytokine levels in LPS‐treated cells. The effect of GW4869 on cellular expression of pro‐inflammatory cytokines IL‐6 and TNF‐α in LPS‐activated macrophages was measured and normalized against 18S rRNA. Values in naive RAW 264.7 cells without GW4869 and LPS treatment were set as unit. Values are mean ± s.e.m. and n = 3.
-
F, G
Effect of siRNA‐mediated downregulation of protein HuR on cellular expression of pro‐inflammatory cytokines. In the left panel (F), effect of siRNA treatment on cellular cytokine mRNA levels in LPS‐stimulated RAW 264.7 cells is shown. Relative levels measured against 18S rRNA are plotted. The effect of HuR depletion on cellular miR‐155 content has been measured, and relative values normalized against U6 snRNA are plotted (right panel, F). The amount of let‐7a bound to Ago2 after LPS stimulation in the presence and absence of siHuR has been calculated, and relative values have been normalized to immunoprecipitated Ago2 (G). Values are mean ± s.e.m. and n = 3.
-
H, I
Effect of HuR expression on inflammatory responses in macrophage cells. Effect of ectopic expression of HuR on let‐7a content of EVs in naive macrophage cells (H, right panel). HA‐HuR expression was checked by Western blot (H, left panel). The effect of HA‐HuR expression on production of pro‐inflammatory cytokine TNF‐α in RAW 264.7 cells was measured. mRNA and protein level of TNF‐α was quantified. Values obtained with pCINeo expression and without LPS treatment were taken as unit (I). Transfection was done either with pCIneo (control plasmid) of HA‐HuR expression construct, and their effect on cellular pro‐inflammatory cytokine mRNA levels in RAW64.7 cells was determined. Values in control set were taken as unit. Values are mean ± s.e.m. and n = 3.
-
J
Effect of HA‐HuR expression on p38‐mediated activation of downstream signalling events. The levels of p‐p38 and p‐MSK1 and non‐phosphorylated version of the p38 and MSK1/2 have been monitored by Western blotting done with cell extracts prepared from HA‐HuR and control plasmid transfected, untreated and LPS‐treated RAW 264.7 cells. β‐Actin blot was used as loading control.
-
K–M
Downregulation of HuR in Ld‐infected macrophages. HuR levels were monitored against time in Ld‐infected primary macrophage cells (PEC) from BALB/c mice (K, upper left panel) as well as in Ld‐infected RAW 264.7 cells (K, upper right panel). HuR levels were also monitored against time in L. major‐infected RAW 264.7 cells (K, lower left panel) and L. mexicana‐infected RAW 264.7 cells (K, lower right panel). Effect of proteasomal inhibitor MG132 treatment on HuR protein levels in control and 6 h of Ld‐infected RAW 264.7 cells. In parallel assays, levels of pro‐inflammatory cytokine TNF‐α were measured in Ld‐infected cells either with no treatment or pre‐treated with MG132 (L). Values are mean ± s.e.m. and n = 3. The isotonic cell lysates prepared from 6‐h Ld‐infected cells were analysed on an OptiPrepR density gradient, and HuR levels in individual fractions were determined. Input samples were monitored for HuR downregulation by Western blot. The presence of Alix (marker for early endosomes) and Calnexin (marker protein for ER) were used to confirm separation of organelles during density gradient fractionation. Loss of HuR from ER‐associated fraction has been noted along with their reduction in total lysate after Ld infection (M upper panel). Densitometric analysis of individual fractions was done, and the respective values were plotted (M, lower panel).
Data information: HC: heavy chain. In all experimental data, ns: non‐significant and *, ** and *** represent
P‐value of < 0.05, < 0.01 and < 0.001, respectively, calculated by Student's
t‐test. For statistical analysis, all experiments are done three times. Exact
P‐values against each experimental set are presented in the
Appendix Table S2. Positions of molecular weight markers are marked and shown in the Western blots used in different panels.
Source data are available online for this figure.

