-
A–C
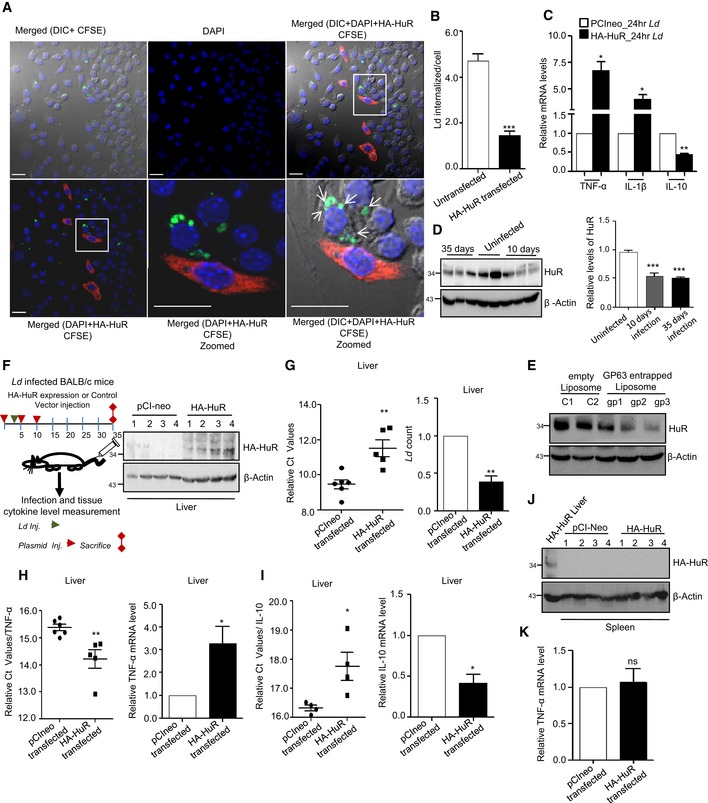
Effect of HA‐HuR expression on Ld infection of RAW 264.7 cells. Effect of HuR expression on internalized parasite number and cytokine expression in RAW 264.7 cells. HA‐HuR was transfected to RAW 264.7 cells, and infection was given for 24 h at a host to parasite 1:10 ratio. Ld was stained with CFSE dye, and parasite internalization was detected by counting the CFSE‐positive structures inside the cells. HA‐HuR was immunostained with anti‐HA antibody and detected by secondary antibody tagged with AlexaR564 (A). Zoomed part of the merged picture are used to show the internalized parasite. Internalized parasites present in HA‐HuR‐positive cells were counted and compared against untransfected cells without HA‐HuR expression (B). Levels of expression of different cytokines are measured in control or HA‐HuR‐expressing RAW 264.7 cells infected with Ld (C). Scale bar 20 μm. Values are mean ± s.e.m. and n = 3.
-
D, E
Effect of Ld infection on the HuR expression in mouse liver. BALB/c mice of 6 weeks of age were infected with Ld via cardiac puncture. Animals were sacrificed after subsequent days; protein was extracted from liver tissue followed by Western blot analysis for HuR. β‐Actin was used as loading control (D, left panel). Each lane have extracts of livers from individual animal. In each case, HuR level was normalized by respective β‐Actin bands (D, right panel mean ± s.e.m., n = 5). Animals were injected with GP63‐containing liposome (gp1–3) or empty liposome (C1‐2), and after 24 h of injection, HuR level was checked against β‐Actin used as loading control (E).
-
F–I
Effect of expression of HA‐HuR on Ld infection in mice liver. Scheme for animal experiments done by expressing HA‐HuR in mouse liver is shown. HA‐HuR level was detected in the liver tissue by Western blot analysis using anti‐HA antibody (F). Parasite load in liver tissues was estimated by measuring Ld DNA in infected tissue using specific primer for Ld minicircle kDNA. Values are mean ± s.e.m. and n = 5 (G). TNF‐α (values are mean ± s.e.m. and n = 5) and IL‐10 (values are mean ± s.e.m. and n = 4) mRNA levels were checked from RNA isolated from liver tissues, and 18S rRNA normalized C
t values were plotted (H and I, left panels). Relative fold change was calculated by ΔΔC
t method and the values plotted for Ld count, TNF‐α and IL‐10 mRNA levels [G mean ± s.e.m. (n = 5), H mean ± s.e.m. (n = 6) and I mean ± s.e.m. (n = 4), right panel].
-
J, K
Effect of HA‐HuR plasmid tail vein injection on mice spleen. Levels of HA‐HuR were undetectable in mice spleen after HA‐HuR expression plasmid was injected. Sample from one liver tissue of HA‐HuR injected group was used as a positive control of HA‐HuR expression in mouse liver after tail vein injection of HuR encoding plasmid (J). Simultaneously, TNF‐α mRNA levels were checked in spleen total RNA (K). Values are mean ± s.e.m. and n = 4.
Data information: In all experimental data, ns: non‐significant and *, ** and *** represent
P‐value of < 0.05, < 0.01 and < 0.001, respectively, calculated by using Student's
t‐test. For statistical analysis, all experiments are done three times. Exact
P‐values against each experimental set are presented in the
Appendix Table S2. Positions of molecular weight markers are marked and shown in the Western blots used in different panels.
Source data are available online for this figure.

