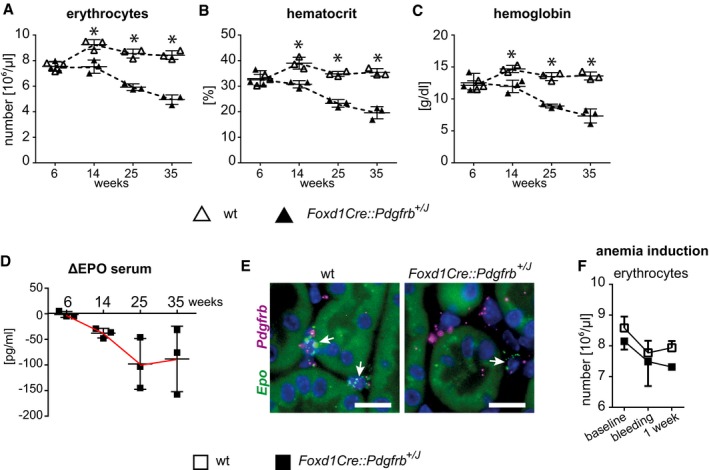
Figure 6. The Foxd1Cre::Pdgfrb +/J mice develop progressive renal anemia and are unable to regulate erythropoiesis under pathological stimuli.

-
A–DErythrocyte numbers (A), hematocrit (B), and hemoglobin content (C) decrease in Foxd1Cre::Pdgfrb +/J mice continuously. (D) EPO levels shown as delta from respective wt littermates. Horizontal lines are means ± SD of n = 3 per group. Statistical analysis was performed by unpaired two‐tailed Student's t‐test. *P < 0.05 compared to wt of the same time point. Exact P‐values are provided in Appendix Table S4.
-
ERNA in situ hybridization (RNAscope) of Epo (green) and Pdgfrb (purple) in renal kidney cortex of 35‐week‐old mice shows that EPO‐producing cells co‐express Pdgfrb. Foxd1Cre::Pdgfrb +/J mice have less EPO‐producing cells (arrows) than wt mice. Scale bar = 25 µm.
-
FAfter induction of anemia by blood taking, the erythrocyte numbers recovered after 1 week in wt mice, whereas Foxd1Cre::Pdgfrb +/J mice were not able to recover their erythrocytes numbers at all. Data are means ± SD of n = 5 per group. Statistical analysis was performed by unpaired two‐tailed Student's t‐test. *P < 0.05 compared to wt of the same time point. Exact P‐values are provided in Appendix Table S4.
Source data are available online for this figure.
