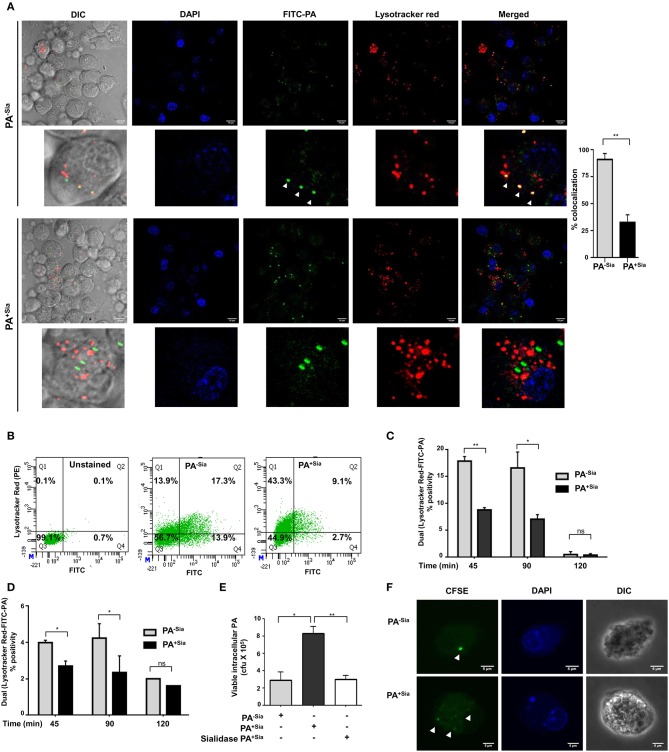
Figure 4.
Phagosome-lysosome fusion was impaired in PA+Sia infected macrophages leading to bacterial survival. (A) J774A.1 cells (5 × 10⁴) seeded on coverslips were infected with FITC-PA−Sia/PA+Sia at MOI 10 for 15 min at 4°C, non-adherent bacteria were then removed and infection was continued till 1 h at 37°C. Lysosomes were labeled with Lysotracker red dye, cells were fixed, mount and analyzed by microscopy. Colocalization of bacteria (green) and lysosomes is indicated by yellow color in merged images. Also, white arrows are used to denote areas of colocalization between FITC-PA and lysosomes. Images are representative of three independent experiments performed. Zoomed-in images are also provided. Scale bar = 10 μm. (B,C) Fusion of phagosomes with lysosomes was analyzed through flow cytometry. Lysotracker stained J774A.1 were similarly infected with FITC-PA−Sia/PA+Sia for 45, 90, and 120 min. Cells were gently lysed, phagosomes were collected and analyzed by flow cytometry. Dual fluorescence positivity represents successful phagosome-lysosome fusion as shown by dot plots and bar graphs. Bar graphs are prepared from data (mean ± s.e.m.) of three independent experiments. (D) Phagosome-lysosome fusion was similarly quantified in human macrophages (THP-1 derived macrophages) and shown in a bar graph. Data represented (mean ± s.e.m.) from three independent experiments. (E) Viability of bacteria in macrophages following phagocytosis was assessed using gentamicin protection assay. Macrophages were incubated with PA−Sia/PA+Sia/sialidase-treated PA+Sia at 1:10 MOI for 30 min at 37°C followed by 3 h incubation with gentamicin (200 μg/mL). The viability and persistence of internalized bacteria were checked by plating the lysed macrophage contents on nutrient agar plates and checking for growing bacterial colonies (colony forming units, cfu). Data represented as mean ± s.e.m. of three independent experiments. (F) Macrophages infected with CFSE stained PA−Sia/PA+Sia were visualized by confocal microscopy to detect presence of bacteria (green specks). Scale bar = 5 μm Data represented as mean ± s.e.m. of three independent experiments. In all experiments, significance is represented as nsp> 0.05, *p ≤ 0.05, and **p ≤ 0.01.

