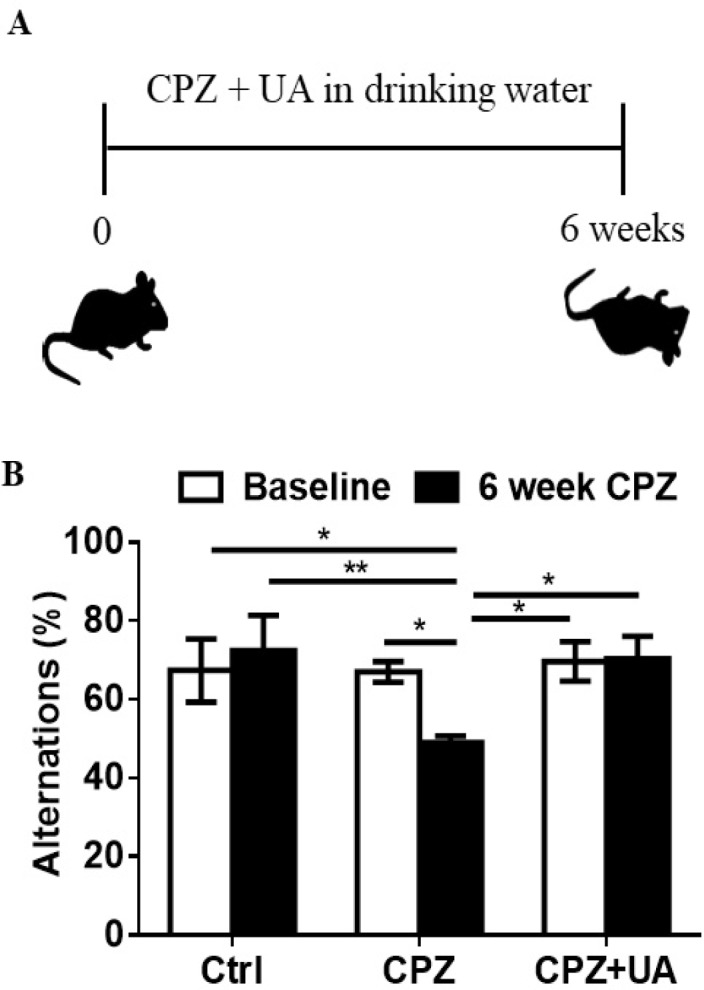
Figure 2.

Effect of UA on memory performance in mice treated with cuprizone. (A) Schematic representation of the protocol of UA administration in drinking water (1 mg/mL). (B) Spontaneous alternations was assessed using the Y-maze test (n = 6). Ctrl: animals which received normal food and water, CPZ: animals which received normal water and cuprizone food, CPZ+UA: animals which received cuprizone food and UA in drinking water. *p < 0.05, **p < 0.01 compared to the CPZ group
