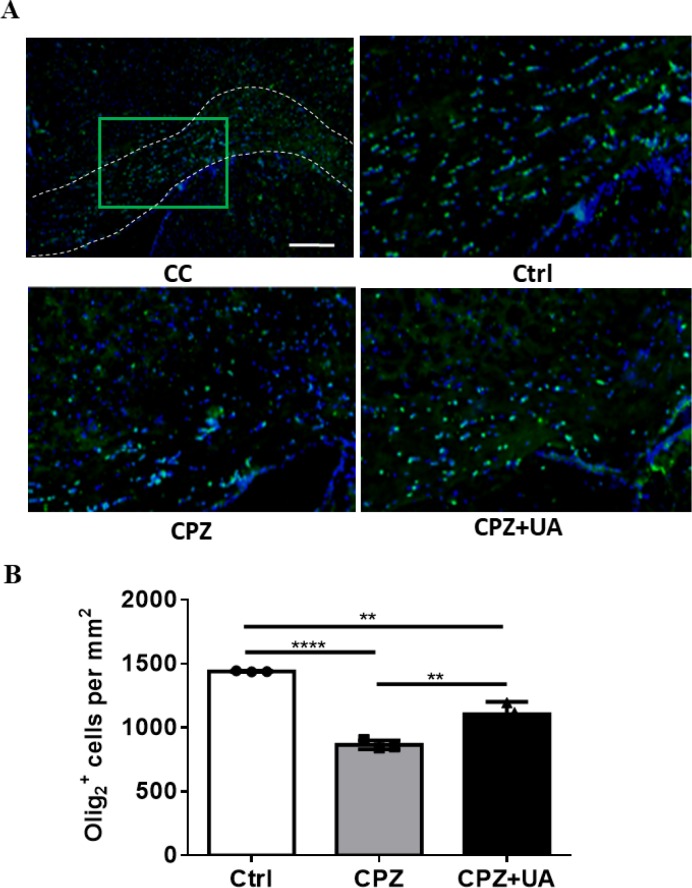
Figure 6.
Changes in number of Olig2+ cells as a marker protein for oligodendrocyte lineage cells following 6 weeks CPZ feeding
(A) Immunofluorescence images of oligodendrocyte lineage cells (OPCs+ OLs) stained using Olig2 antibody. (B) Quantification of Olig2+ cells as counted number per area (mm2). Cells were counterstained with DAPI. ***p < 0.001 compared to CPZ group, **p <0.01 compared to CPZ+UA group. Scale bars: 100 μm. N = 3.

