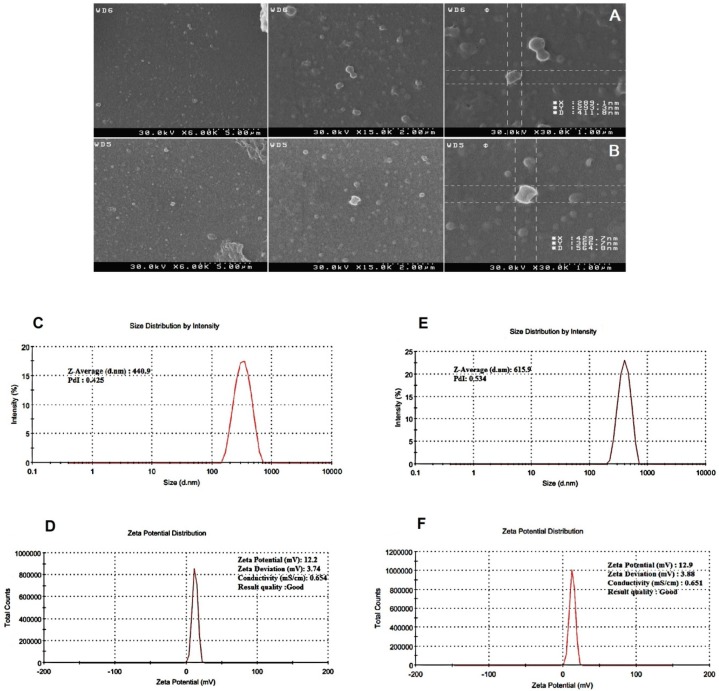
Figure 3.
Characterization of PLGA/PEI nanoparticle. Scanning electron microscope (SEM) images showing the spherical morphology of PLGA/PEI nanoparticles (A) Blank PLGA/PEI and (B) mRNA-encapsulate PLGA/PEI. (C) size and (D) zeta potential of Blank PLGA/PEI nanoparticle, (E) size and (F) zeta potential of GFP-encapsulate PLGA/PEI nanoparticle. The images show the values associated with one measurement. Measurements were repeated three times for the formulation of each nanoparticle

