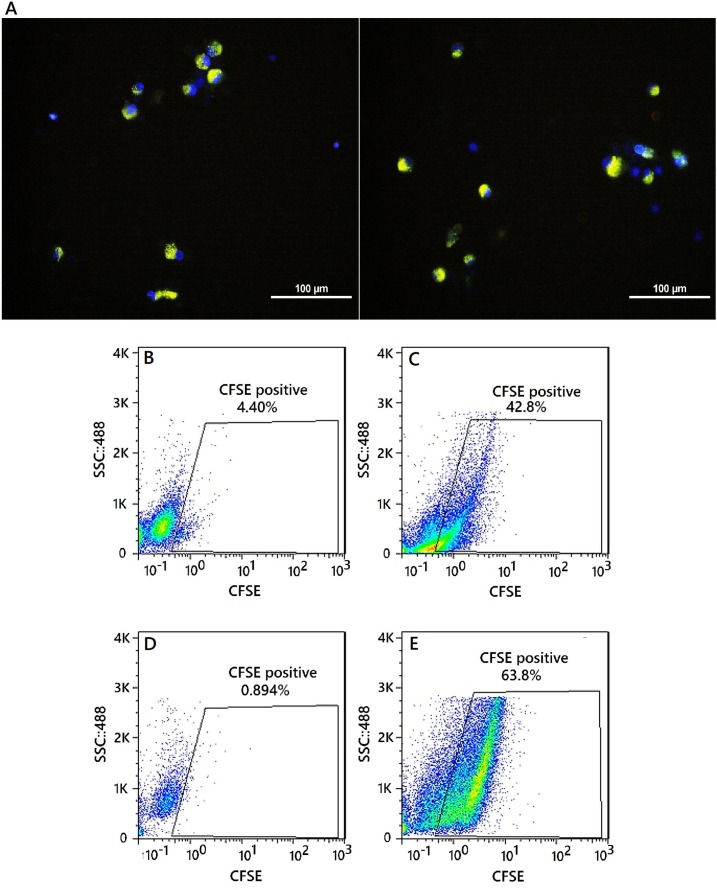
Figure 7.
Intracellular uptake of CFSE-encapsulating nanoparticles by moDCs. (A) Fluorescent images of uptake of CFSE-encapsulating nanoparticles by moDCs. Merged DAPI and CFSE image. Nanoparticles are greenish-yellow and the nucleus is blue, nuclei stained with Hoechst 33258. Scale bars represent 100μM. Flow cytometry analysis of moDCs encapsulated the CFSE labeled nanoparticles. (B andD) CFSE-positive moDCs were not exposed to the nanoparticle and gated in a CFSE-(FL1) dot plot (Day 0). (C) CFSE-positive moDCs were exposed to the nanoparticle (12 h after the exposure - percentage of positive cell: 42.8%). (E) CFSE-positive moDCs were exposed to the nanoparticle (24 h after the exposure - percentage of positive cell: 63.8%)

