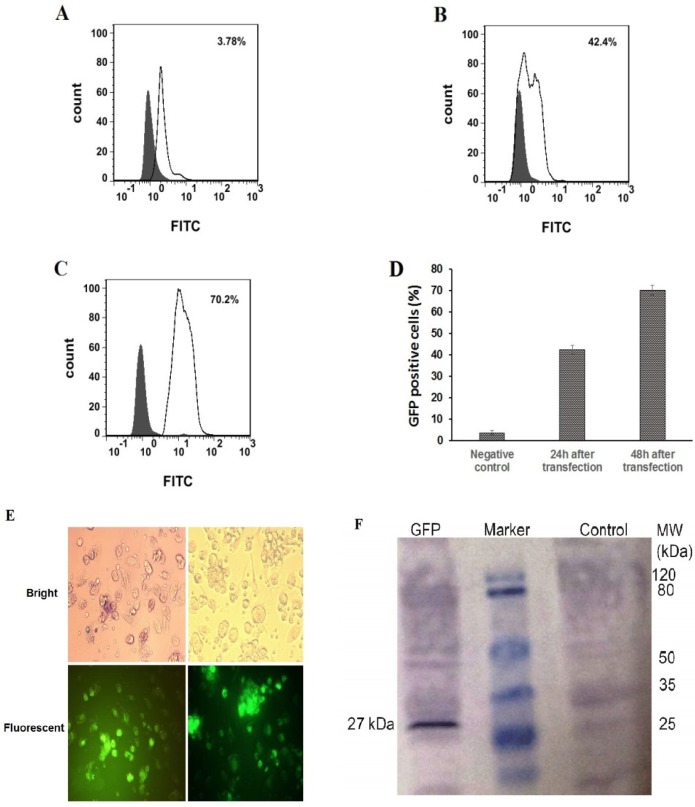
Figure 8.
Flow cytometry analysis, fluorescence microscopic images and western blotting of GFP PLGA/PEI NPs-treated moDC cells. GFP PLGA/PEI nanoparticles were added to the cell culture media at the final concentration of 5 μg/mL and GFP protein expression was measured 24-48 h post treatment. (A-D) flow cytometry analysis of GFP PLGA/PEI NPs-treated moDCs. (A) As a control, moDCs only treated with PBS buffer (Negative Control). (B and C). Percentage of GFP positive moDCs were transfected with PLGA/PEI NPs encapsulation of GFP mRNA 24 h and 48 h after transfection respectively. The percentage number in the fluorescence- activated cell sorting profile represents the percentage of GFP-expressing cells sorted within a prefixed gate region. (D) The comparison percentage of GFP positive moDCs in control negative and after transfection of moDCs with PLGA/PEI NPs encapsulation of GFP mRNA. The results represent the mean ± SD (n = 3 for one of three independent experiments). P < 0.05 by One-way analysis of variance as compared with the corresponding controls. (E) GFP expression in moDCs using fluorescence microscopy. Immature moDCs were transfected with PLGA/PEI NPs encapsulation of GFP mRNA and were analyzed for GFP protein expression 48 h after transfection. GFP protein expressed in moDCs have been indicated in fluorescent microscopy fields (Down). (F) Western blotting for detect expression of GFP protein in moDCs 48 h after transfection by PLGA/PEI NPs encapsulation of GFP mRNA. The right line of marker is protein extract from the un-transfected DCs as negative control and the left line of marker is GFP protein with the expected molecular mass (27 kDa) in the DCs extract

