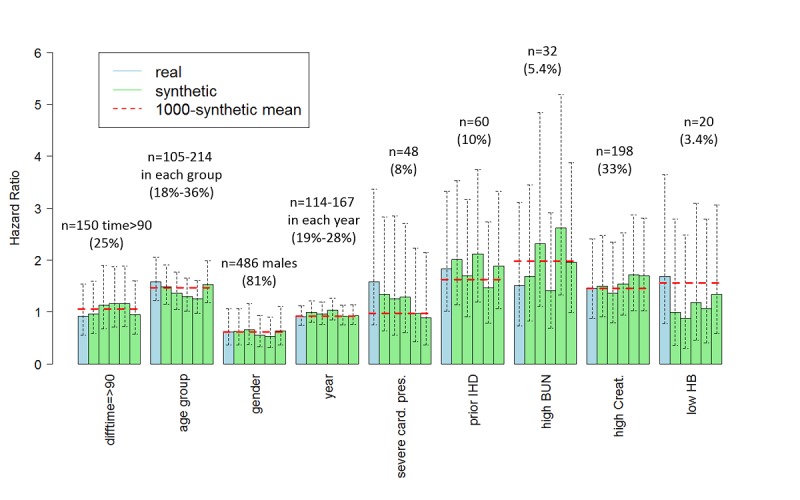
Figure 3.

Hazard ratios with 95% confidence intervals for CHF or mortality within 180 days of primary PCI based on real data (blue) and on five synthetic datasets (green). For each variable, the number of cases and percentage in the real data is given. Conclusions were typically consistent between the real and the synthetic data, and across the synthetic sets. In the case of increased risk with age, some variability was observed. The mean result across 1000 synthetic sets (dotted red line) for results with high confidence, was close to the result from the real data, implying small bias.
