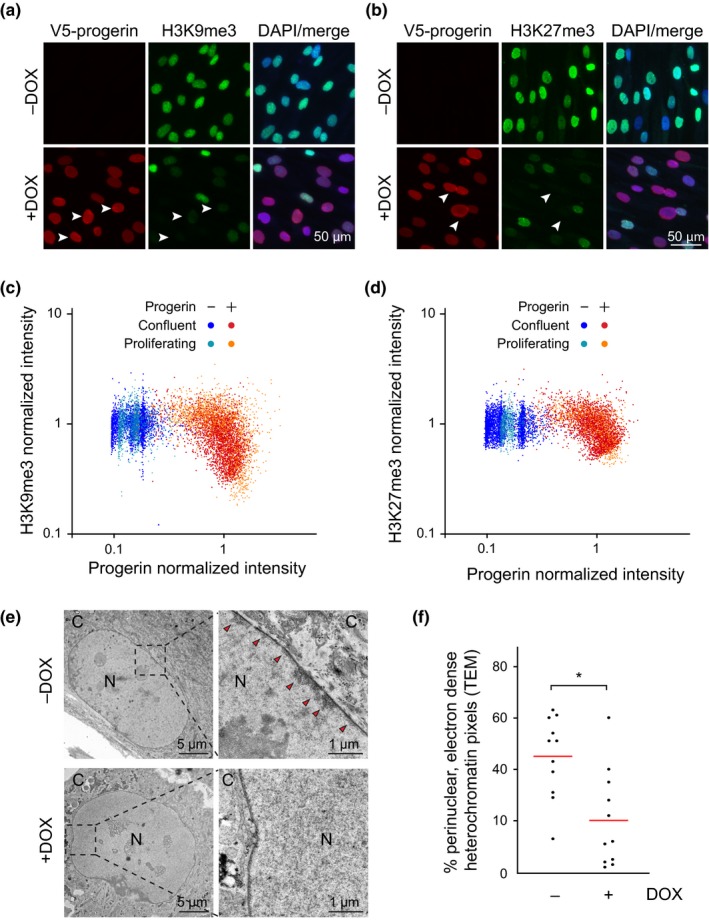
Figure 1.

Progerin‐dependent loss of H3K9me3 and H3K27me3 heterochromatin marks in G1‐arrested confluent NDF. (a,b) Immunofluorescence microscopy of H3K9me3 (a) and H3K27me3 (b) staining in G1‐arrested cells in the presence or absence of progerin. V5‐progerin (V5 antibody) and H3K9me3/H3K27me3 antibodies are indicated, with DAPI overlay. Scale bar: 50 μm. Progerin‐expressing cells with extensive loss of H3K9me3 or H3K27me3 are marked by white arrowheads. (c,d) Scatter plot analysis of H3K9me3 (c) or H3K27me3 (d) and progerin levels in confluent or proliferating NDF in the presence (red, orange) or absence (blue, light blue) of progerin. H3K9me3 or H3K27me3 and progerin normalized intensities are plotted on Y and X axis, respectively. A total of ~9 × 10³ and ~7 × 10³ nuclei were quantified for H3K9me3 and H3K27me3 analysis, respectively, from 3 independent experiments. (e) Electron microscopy imaging of peripheral heterochromatin in confluent NDF in the presence (lower panel) or absence (upper panel, red arrowheads) of progerin. Nucleus (N) and cytoplasm (C) are indicated, scale bars: 5μm (left panels) and 1μm (right panels). (f) Quantification of perinuclear heterochromatin from TEM images in the absence (−DOX) and presence (+DOX) of progerin (see Figure S1‐1a) (*p < .05, n = 11 cells per condition, Mann‐Whitney test)
