Figure 3.

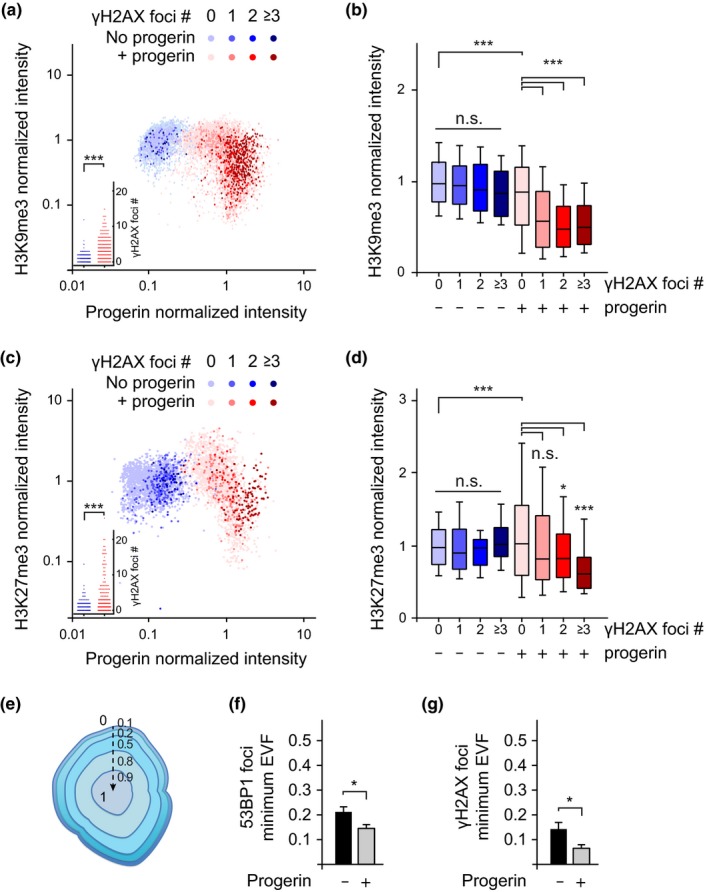
Preferential accumulation of DNA damage foci in cells with lower levels of H3K9me3 and H3K27me3. (a) Scatter plot analysis of H3K9me3, progerin expression and γH2AX DNA damage foci number per nucleus, in NDF expressing progerin (red) or nonexpressing controls (blue). For each nuclei, H3K9me3 and progerin normalized intensities are plotted on Y and X axis, respectively, while the number of DNA damage foci is represented by colour intensity (light to dark colour: 0, 1, 2, 3 or more DNA damage foci per nucleus). Inset: DNA damage counts of the same data (***p < .001, Student's t test). A total of ~ 1x10⁴ cells from 3 independent experiments were analysed. (b) Box plot of data shown in (a), whiskers represent 10–90 percentile (***p < .001, one‐way ANOVA with Tukey's post‐test). (c) Scatter plot analysis of H3K27me3, progerin expression and γH2AX DNA damage foci number. Inset: DNA damage counts of the same data (***p < .001, Student's t test). A total of ~ 4x10³ cells from 3 independent experiments were analysed. (d) Box plot of the same data, whiskers represent 10–90 percentile (***p < .001, *p < .05, one‐way ANOVA with Tukey's post‐test). (e,f) 3D‐SIM analysis of DNA damage foci. Illustration of the Eroded Volume Fraction (EVF) index to assess proximity to the nuclear lamina, from closest (0) to furthest (1) (reproduction of Figure S1‐1b). (f,g) Quantification of the average minimum EVF value for 53BP‐1 (f) and γH2AX (g) DNA damage foci, ± progerin. A total of 225 53BP‐1 and 135 γH2AX DNA damage foci were analysed. (*p < .05, Student's t test)
