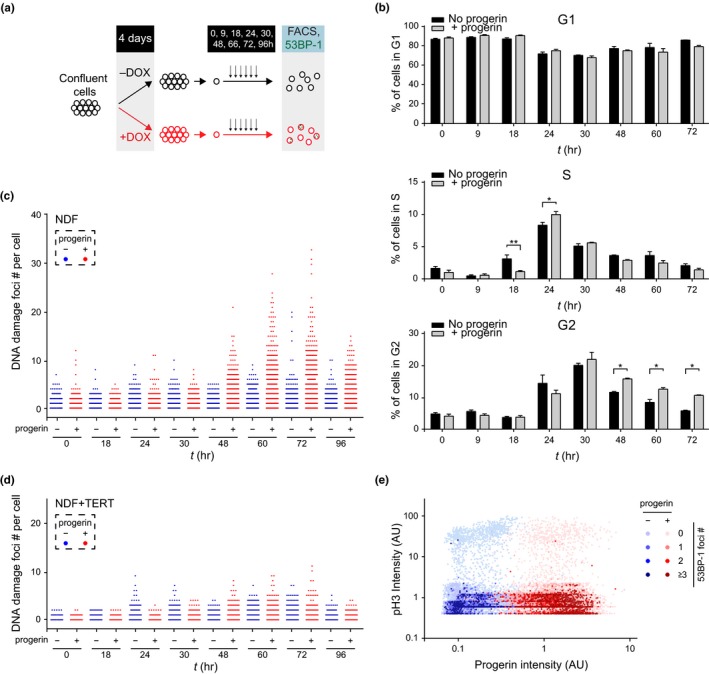
Figure 4.

Progerin‐induced DNA damage occurs in late S‐phase and is associated with a persistent G2 arrest. (a) Schematic representation of the experimental design. (b) Cell cycle profile of control (black bars) and progerin‐expressing (grey bars) NDF at each time point (in hours) after release from G1‐arrest by FACS (% of cells in G1, S‐phase and G2 are shown in top, middle and lower panels, respectively; *p < .05, **p < .01, n = 3, two‐way ANOVA with Sidak's post‐test). (c) DNA damage accumulation in control (blue) and progerin‐expressing (red) NDF upon release from G1. The number of 53BP‐1 foci per cell is displayed at each time point. A total of ~1 × 10⁵ cells from 3 independent experiments were analysed. (d) Quantification of DNA damage foci in control (blue) and progerin‐expressing (red) TERT‐positive NDF upon G1 release. A total of 7 × 10⁴ cells from 2 independent experiments were analysed. (e) Scatter plot analysis of phospho‐H3 (pH3), progerin expression and 53BP‐1 DNA damage foci per nucleus, in control (blue) and progerin‐expressing (red) NDF upon release from G1. Data from all time points post‐G1‐arrest release (0–96 hr) are represented. Phospho‐H3 and progerin normalized intensities are plotted on Y and X axis, respectively, while the number of DNA damage foci is represented by colour intensity. From light to dark colour: 0, 1, 2, 3 or more DNA damage foci. ~9 × 10⁴ cells from 2 independent experiments were analysed
