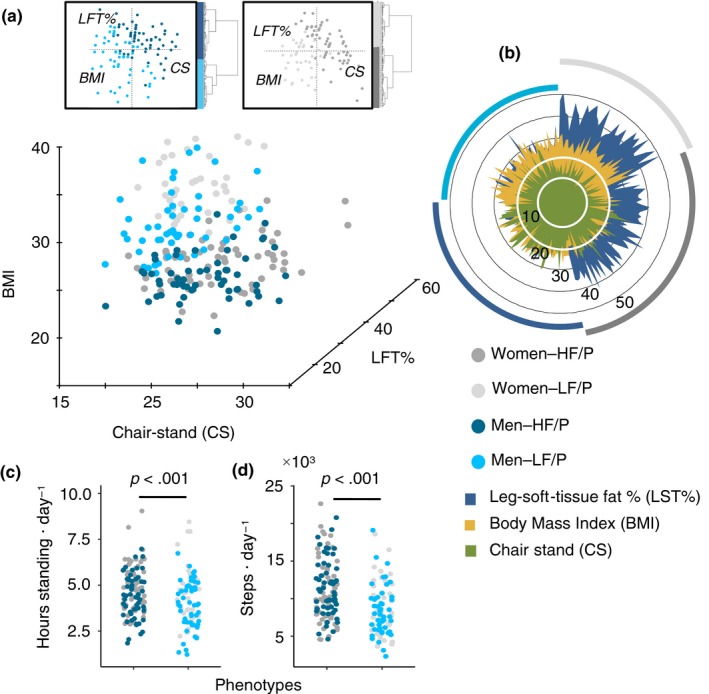
Figure 1.

Stratification of fitness phenotypes. (a) Stratification of subjects (n = 207) by hierarchical clustering analysis of principal components analysis (HCA‐PCA). Stratification data matrix: [obj × vars] = [207 × 3]. HCA‐PCA was performed within sexes and based on ABP measurements. HF/P: high‐fitness (n = 116) and LF/P: low‐fitness phenotypes (n = 91). (b) ABP measurements distribution among phenotypes and sexes. (c) 4‐day activity monitoring displaying hours standing and steps on daily basis for both phenotypes. 4‐day activity data matrix: [obj × vars] = [196 × 2]
