
Figure 2.
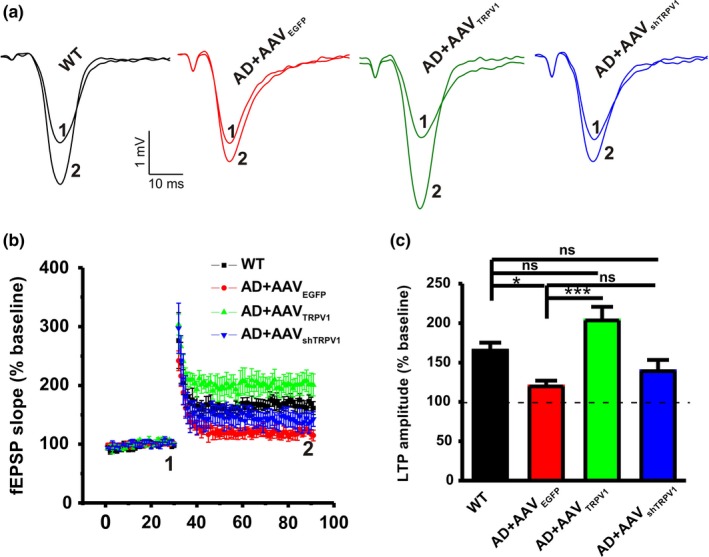
TRPV1 rescues the impairment of LTP in the CA1 area of hippocampus in APP23/PS45 mice. Representative fEPSP traces (a) and plots of the normalized slopes (b) of the fEPSP 5 min before and 55 min after TBS delivery. (c) Bar graphs of the average percentage changes in the fEPSP slope 55–60 min after TBS delivery (n = 5–6 slices from 4–6 mice in each group). One‐way ANOVA: F (3,19) = 7.330, p = .002. Data are expressed as means ± SEM, *p < .05, ***p < .001